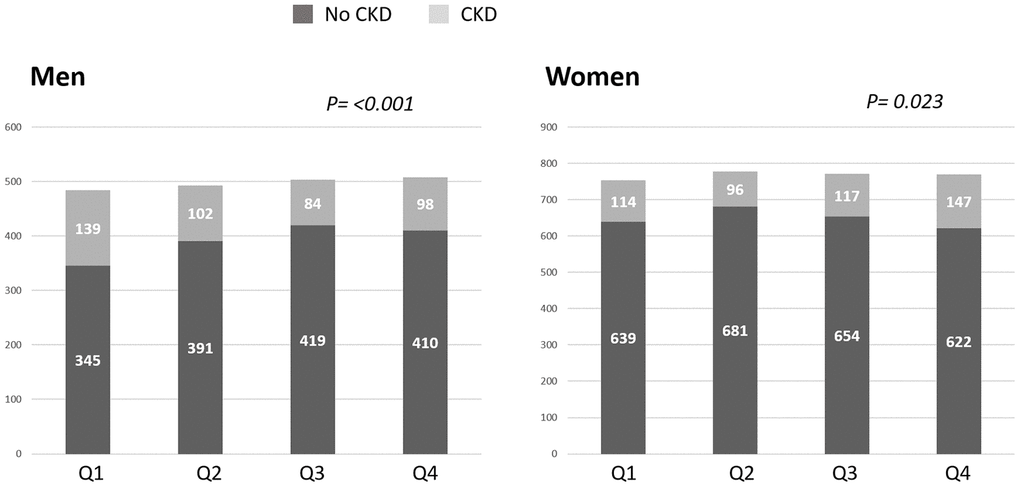
Figure 2.Prevalence of chronic kidney disease (CKD) as according to skeletal muscle index (SMI) quartiles. In men, the prevalence of CKD defined as cystatin C eGFR <60 mL/min/1.73 m2 increased with lower SMI such that the men with the lowest SMI quartile (Q1) had the highest prevalence of CKD. In women, the prevalence of CKD increased with higher SMI quartiles. Q: quartile.