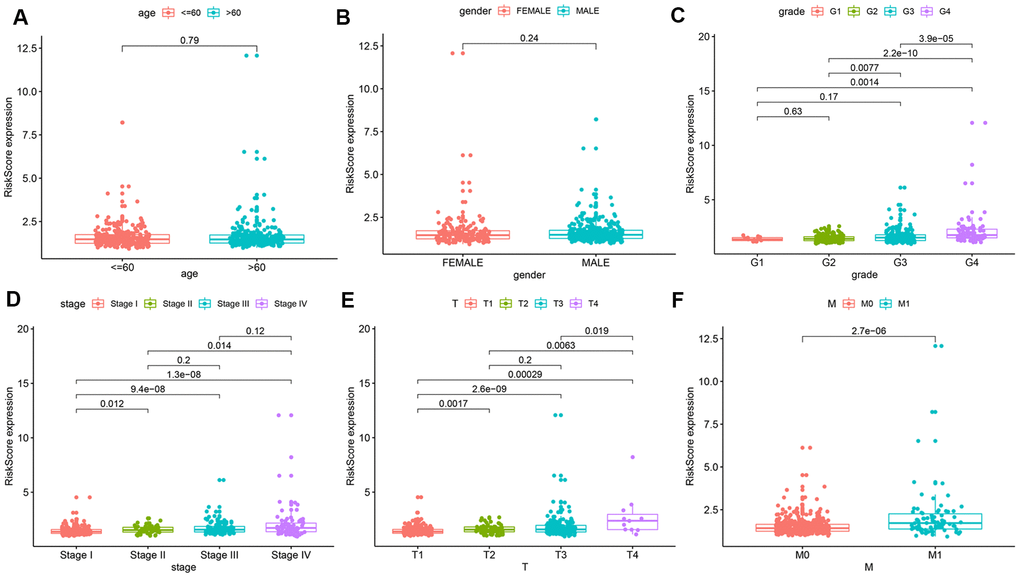
Figure 4.Relationships between risk score and various clinical parameters. Risk scores in cohorts stratified by age (A), gender (B), grade (C), AJCC stage (D), T stage (E), and M stage (F). Risk score is significantly associated with grade, AJCC stage, T stage, and M stage, but not with age or gender.