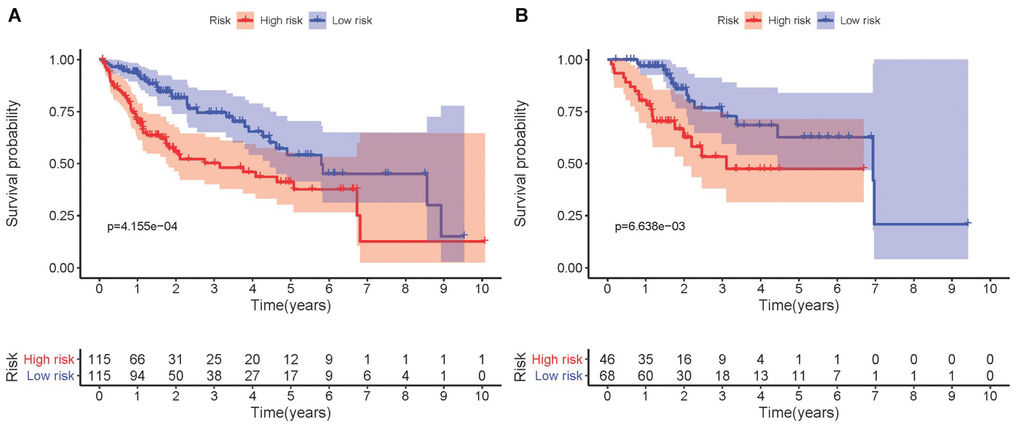
Figure 3.Kaplan-Meier survival analysis involving prognostic metabolic genes in HCC. (A) Kaplan-Meier curve of the training set. (B) Kaplan-Meier curve of the testing set. P-values were < 0.05, indicating that overall survival was significantly different between patients at high- and low-risk.