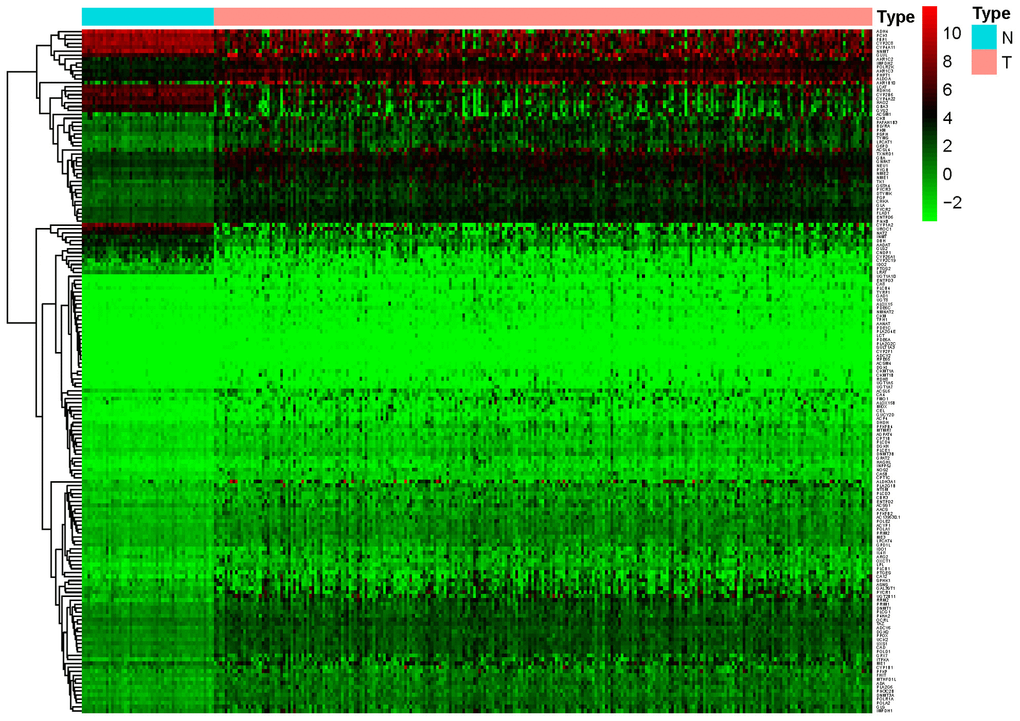
Figure 1.Heat map of differentially expressed genes in the training set. A total of 147 upregulated and 26 downregulated metabolic genes were identified in the tumor dataset compared to the normal dataset, using | logFC |> 1.5, P-value < 0.05, FDR < 0.05 as the screening criteria.