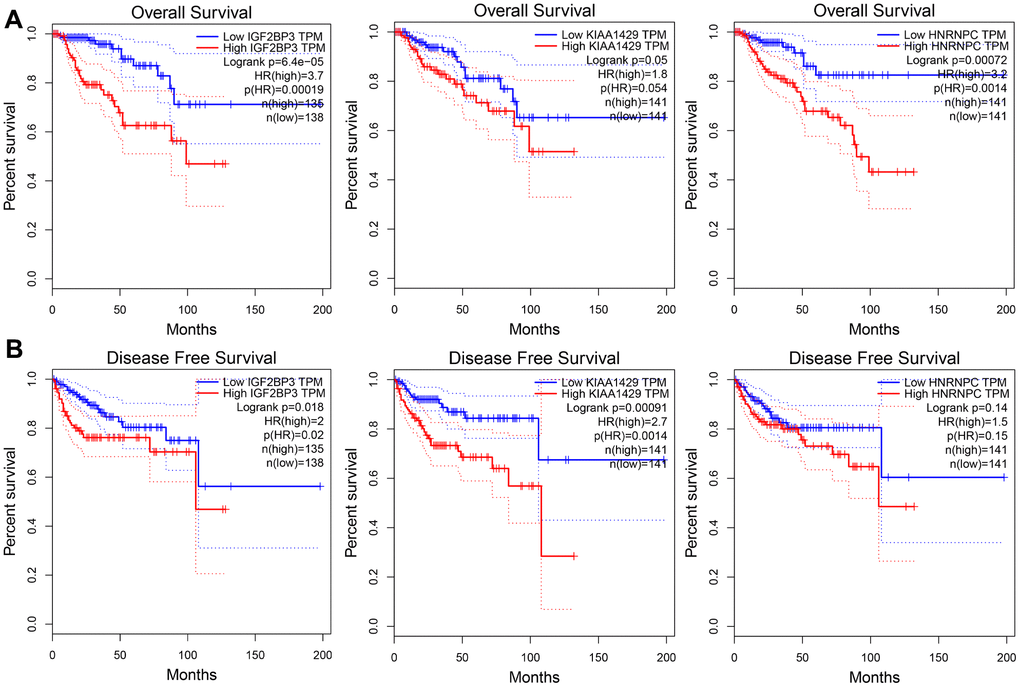
Figure 9.The overall and disease-free survival rates of KIRP patients from the GEPIA database according to the expression levels of the three prognostic risk signature genes. Kaplan-Meier survival curves show the (A) overall survival (OS) and (B) disease-free survival (DFS) rates in KIRP patients from the GEPIA database with high- or low- expression of IGF2BP3, KIAA1429 and HNRNPC genes.