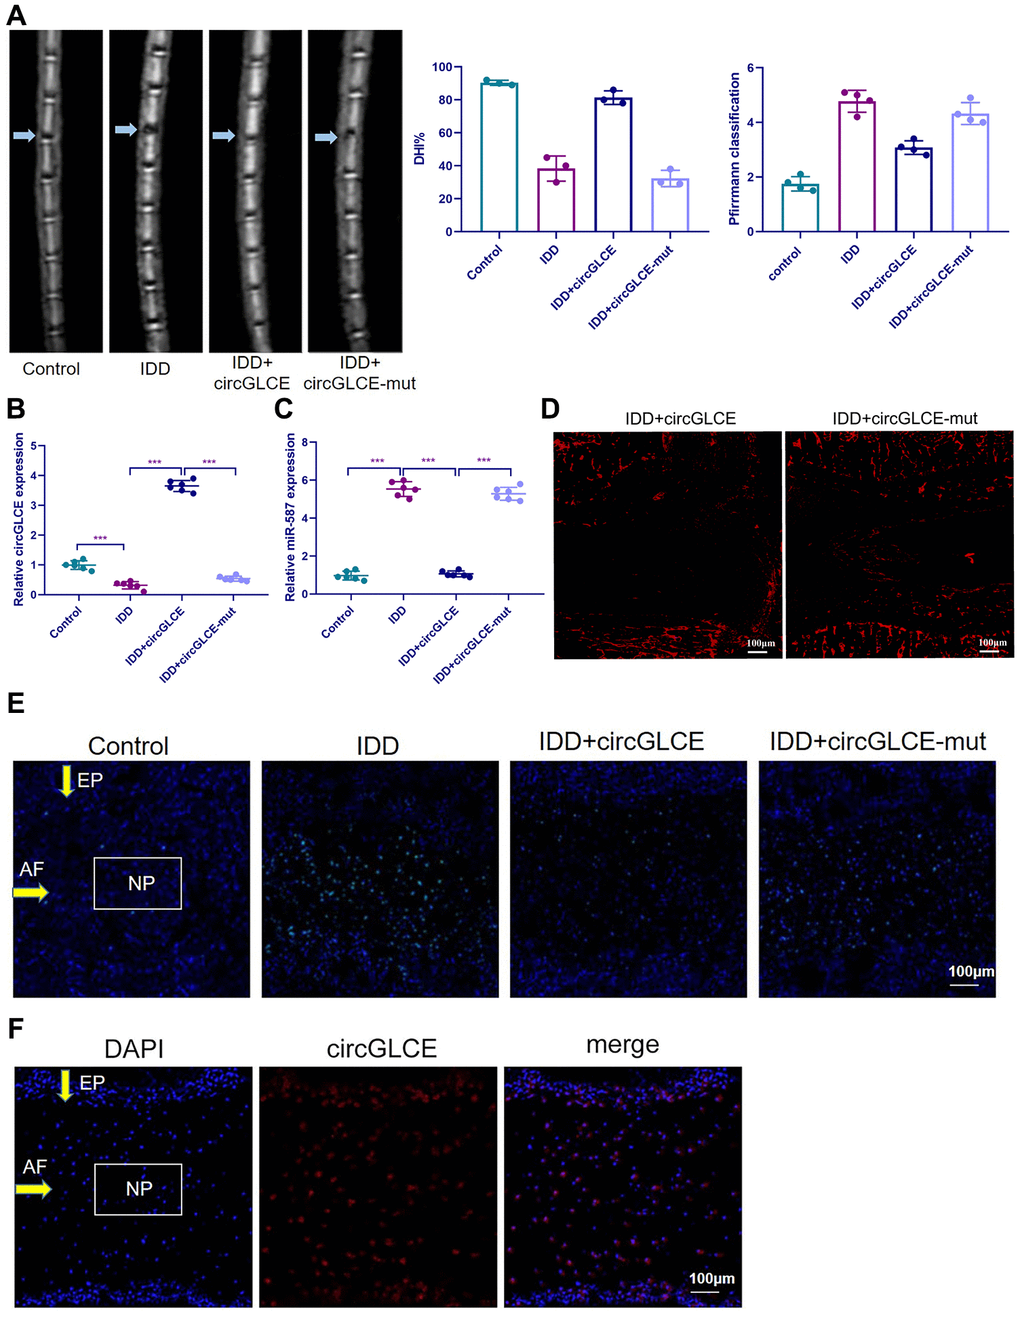
Figure 7.Overexpressed CircGLCE alleviates IDD in vivo. 12 weeks after the induction of IDD and the administration of treatments, (A) MRI was performed and images were obtained; the disc height indices after (n=3, *** P<0.001, unpaired two-tailed Student’s t test); the grading of IDD based on Pfirrmann classification (n=3, *** P<0.001, unpaired two-tailed Student’s t test). (B) RT-qPCR results indicated the CircGLCE levels corresponding to induced IDD and CircGLCE treatments (n=6, ***P < 0.001, unpaired two-tailed Student’s t test). (C) the expression of miR-587 was downregulated by overexpressing CircGLCE in an animal model of induced IDD, as shown with RT-qPCR (n=6, ***P < 0.001, unpaired two-tailed Student’s t test). (D) Cy3-tagged circGLCE NPs analysis. (E) TUNEL staining revealed the in vivo effect of overexpressed CircGLCE on apoptosis after 12 weeks. (F) RNA FISH illustrated the in vivo distribution of CircGLCE in NP tissue.
(G) Western blotting (n=3) showed the expression profiles of ECM markers corresponding to induced IDD and CircGLCE treatments. (H) H&E and immunohistochemistry staining of NP tissues. The cells of the NP region in the intervertebral disc were more abundant in the control and IDD+circGLCE groups than they were in the IDD and IDD+circGLCE-mut groups. The expression of MMP13 was higher in the IDD group than it was in the IDD++circGLCE group. (I) Histological examination (n=6, ** P<0.01, and *** P<0.001; unpaired two-tailed Student’s t test). Data are the mean ± SEM.