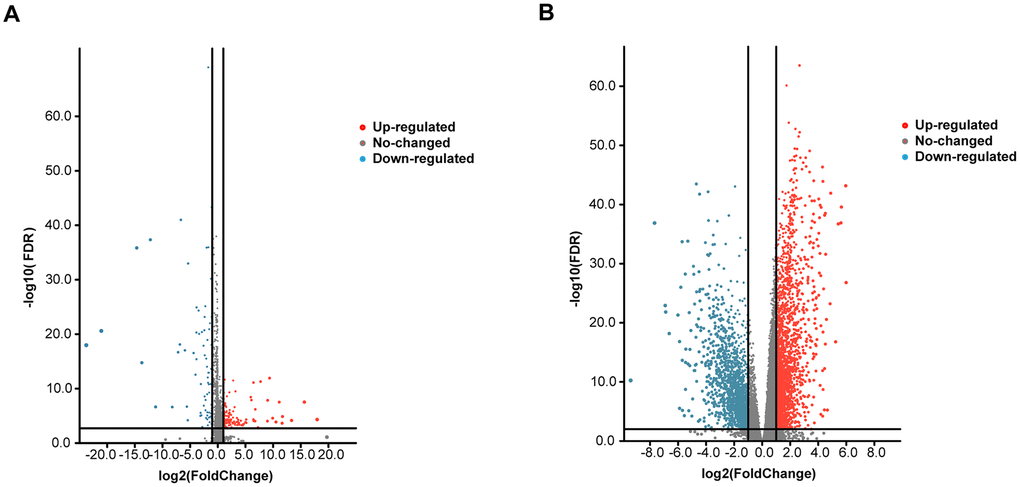
Figure 1.Volcano plot of the differentially expressed mRNAs and lncRNAs between HNSCC and para-carcinoma tissues. Red indicates high expression, and blue indicates low expression (|log2FC| > 1 and P value < 0.05). The Y axis represents adjusted P values, and the X axis represents log2FC values. The RNAs studied in this article have been marked in the figure. (A) Volcano plot of the differentially expressed lncRNAs. (B) Volcano plot of the differentially expressed mRNAs.