Submit an Article
Navigate
Home
Editorial Board
Editorial Policies
Current Volume
Archive
Scientific Integrity
Publication Ethics Statements
Interviews with Outstanding Authors
Newsroom
Sponsored Conferences
Podcast
Contact
Special Collections
Submit an Article
Online ISSN: 1945-4589
Research Paper
|
Volume 12, Issue 20
|
pp. 20743–20752
Determination of the molecular mechanism by which macrophages and γδ-T cells contribute to ZOL-induced ONJ
Back to article
Figure 1
(1 of 7)
−
100%
+
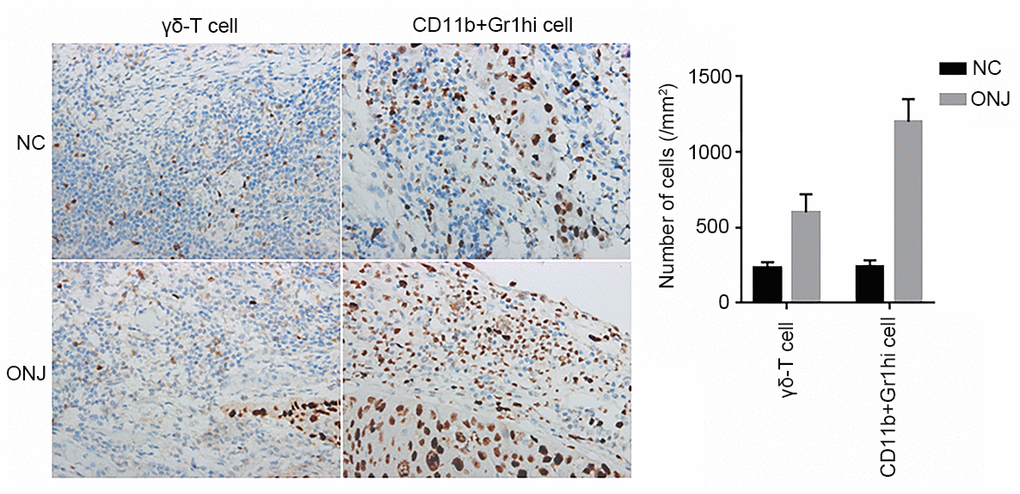
Figure 1.
The distribution of CD11b+Gr1hi cells and γδ-T cells in the necrotic tissue of the jaw.
***
P
<0.001, compared with the NC group.
Figure 1 — Determination of the molecular mechanism by which macrophages and γδ-T cells contribute to ZOL-induced ONJ | Aging