Submit an Article
Navigate
Home
Editorial Board
Editorial Policies
Current Volume
Archive
Scientific Integrity
Publication Ethics Statements
Interviews with Outstanding Authors
Newsroom
Sponsored Conferences
Podcast
Contact
Special Collections
Submit an Article
Online ISSN: 1945-4589
Research Paper
|
Volume 12, Issue 21
|
pp. 21730–21746
Frailty modifies the association between opioid use and mortality in chronic kidney disease patients with diabetes: a population-based cohort study
Back to article
Figure 2
(2 of 3)
−
100%
+
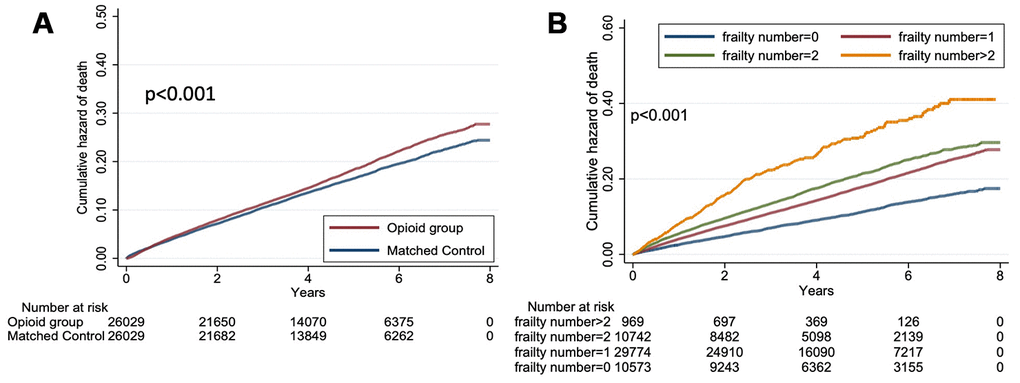
Figure 2.
Kaplan-Meier survival curves based on opioid use or not (
A
) and FRAIL item counts (
B
) among the total cohort (n = 52,058).