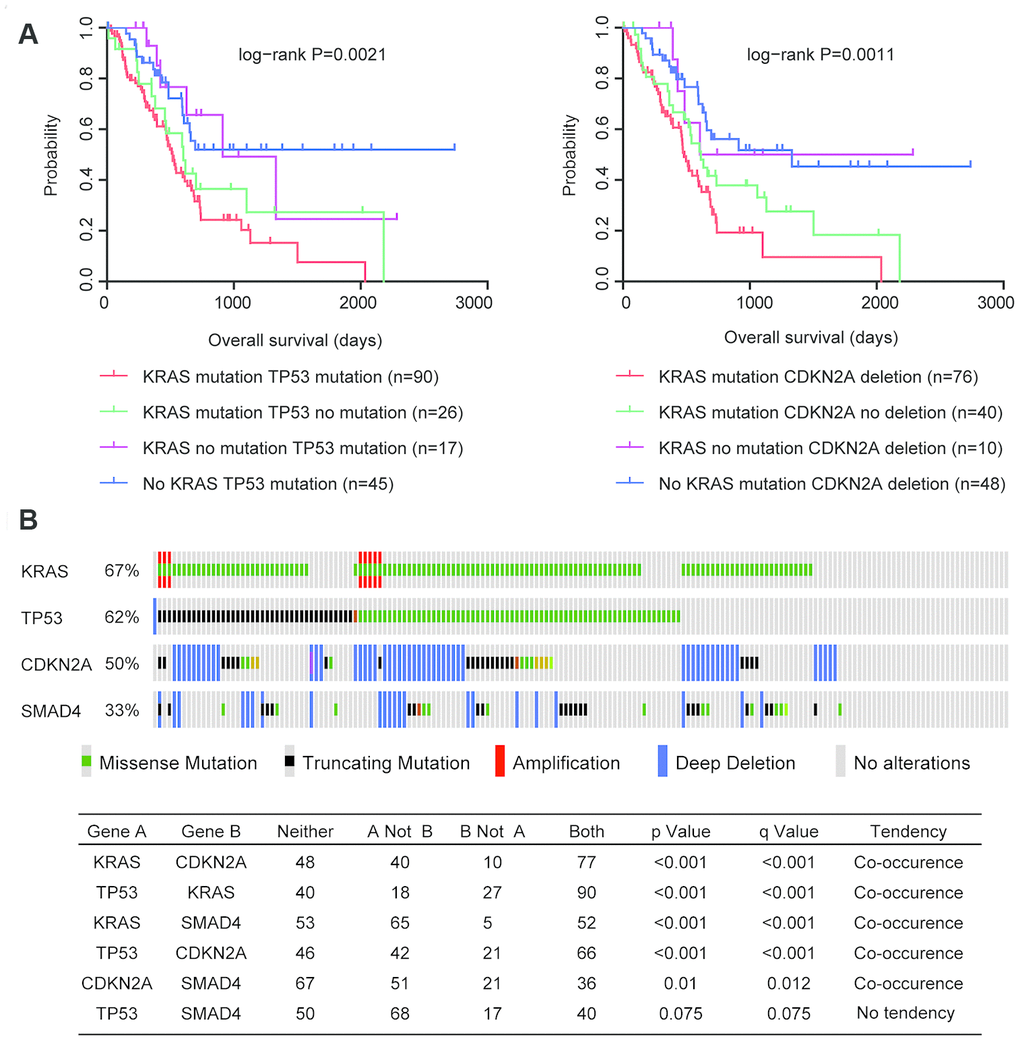
Figure 2.Coordination and co-occurrence of the genomic alterations in patients with pancreatic cancer. (A) Kaplan-Meier plots demonstrated the different overall survival of pancreatic cancer patients with different genomic alterations. P values were generated from Log-rank test. (B) Oncoprint demonstrated the co-occurrence of KRAS, TP53, CDKN2A and SMAD4 alterations in patients with pancreatic cancer derived from TCGA PAAD datasets. Each line represented one patient.