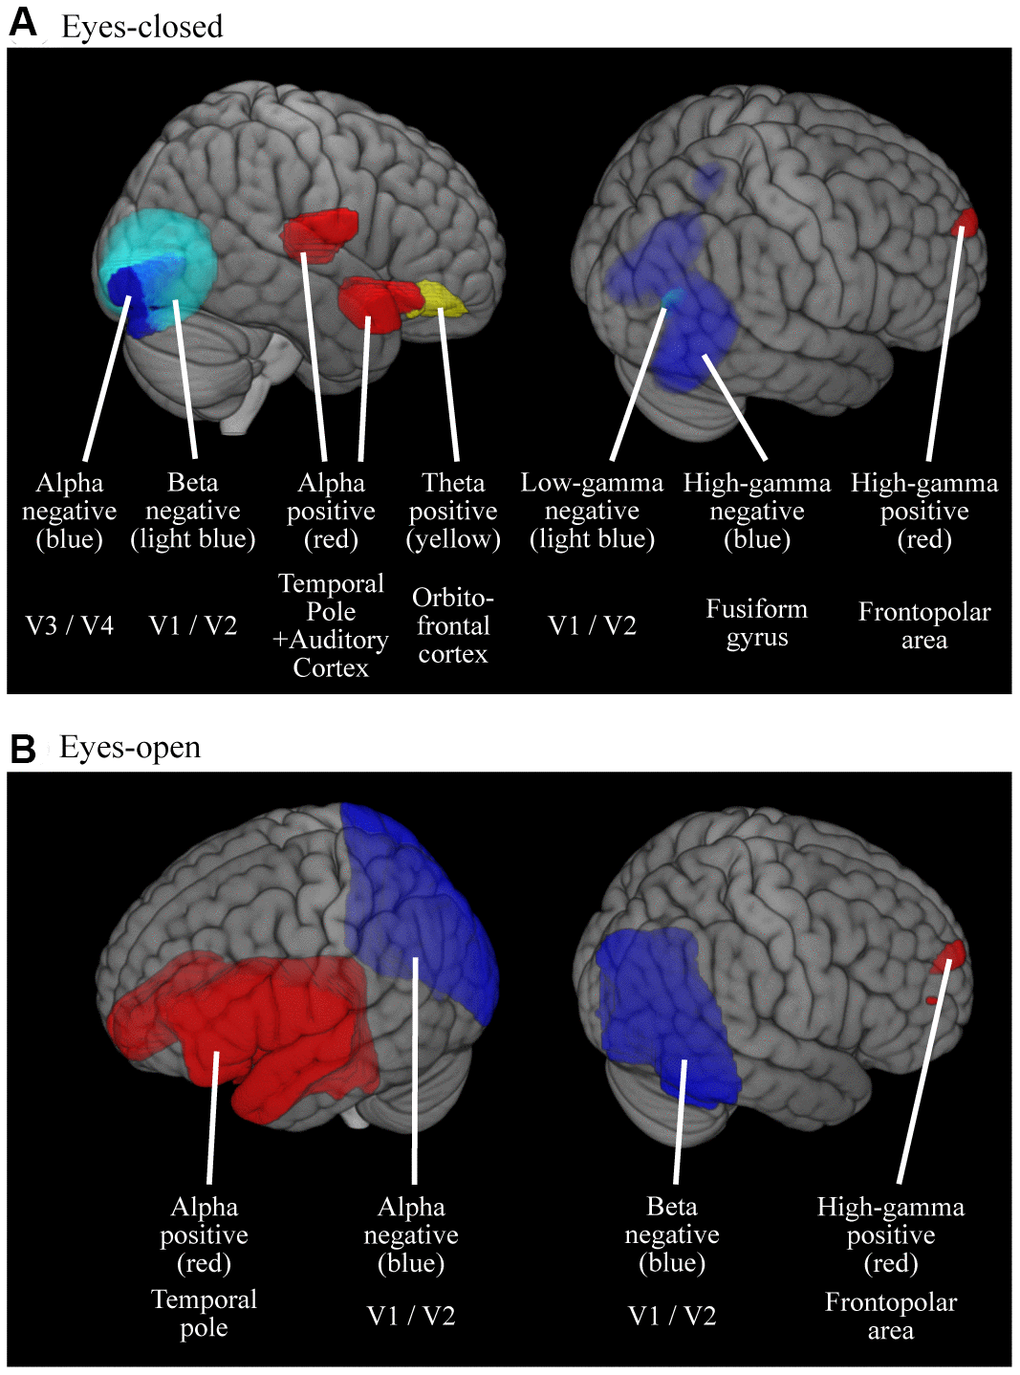
Figure 3.Cortical regions where the oscillatory powers were significantly predicted by age. Colored areas represent the clusters where the oscillatory powers were significantly predicted by age, either in positive- or negative-fashion (p < 0.05, FWE-corrected). The results were thresholded at alpha level then superimposed on the brains, thus the intensities of color do not mean anything. (A) Results for EC condition (B) Results for EO condition. M, Males; F, Females.