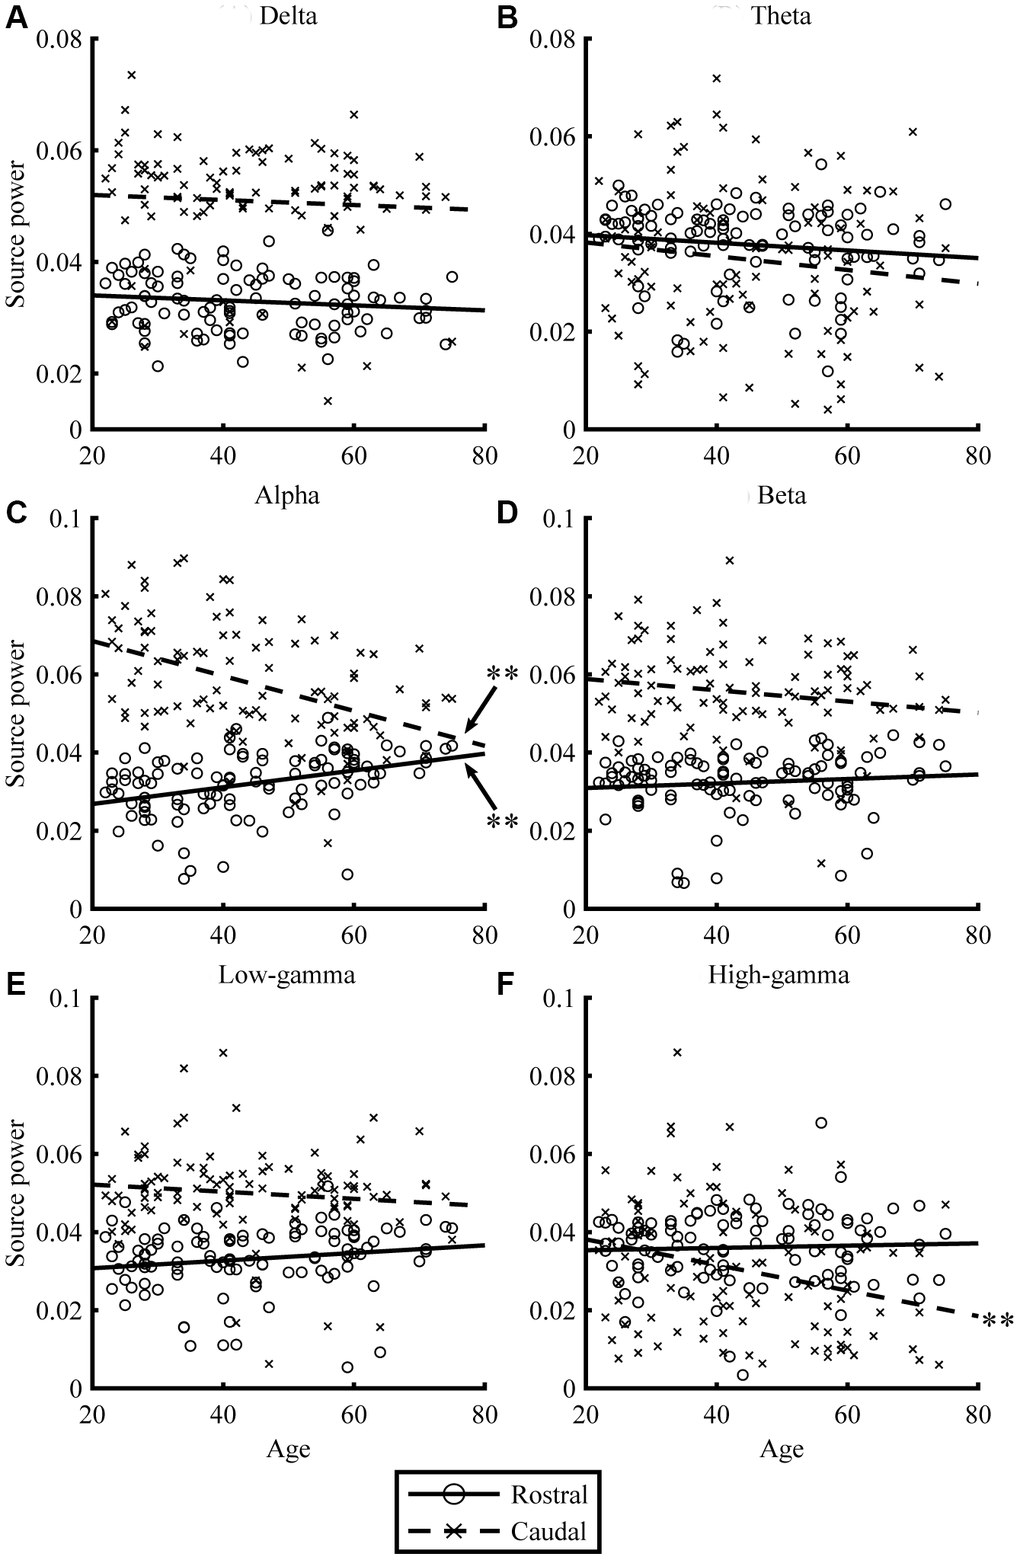
Figure 2.Relationships between age and regional source power for EO condition. The scatterplots visualize the relationships between age (x-axis) and regional source power (y-axis) in each frequency band (A: Delta, B: Theta, C: Alpha, D: Beta, E: Low-gamma, and F: High-gamma band) for EO condition. The lines represent linear-fitted (in a least-squares sense) data. Double asterisks (**) indicate significant correlations (please see Table 2 for statistical values).
Figure 2 — Age- and gender-specific characteristics of the resting-state brain activity: a magnetoencephalography study | Aging