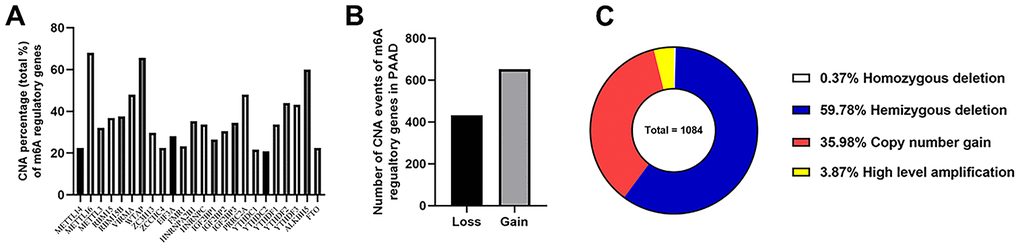
Figure 3.Landscape of CNA events for m6A regulatory genes in PAAD. (A) Percentage of PAAD samples with CNAs of the m6A regulators based on the data from TCGA. (B) Events of copy number gain or loss of m6A regulatory genes in ccRCC samples. (C) Proportion of four kinds of CNA vents.