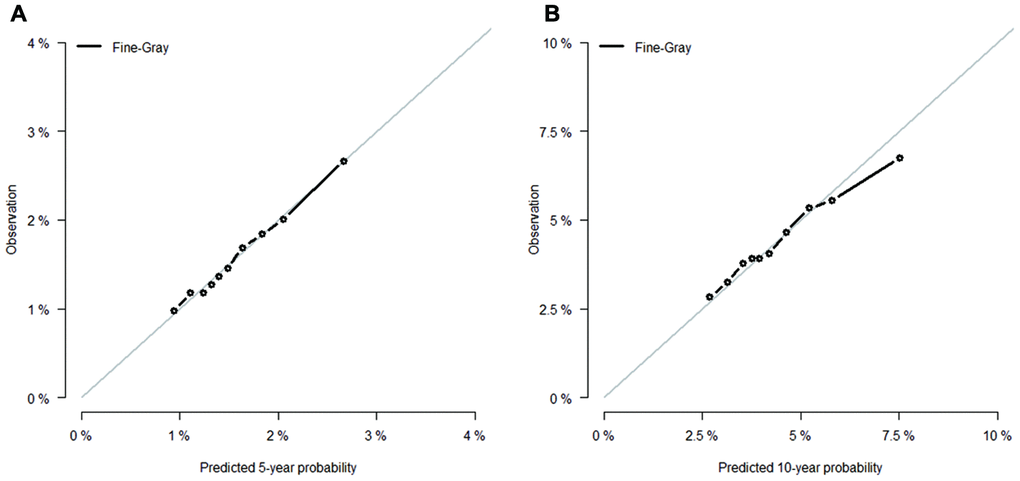
Figure 4.Calibration curves for (A) 5- and (B) 10-year predictions from Fine-Gray model. X-axes indicate predicted 5- or 10-year probabilities; Y-axes indicate actual observations.
Figure 4 — Risk factors and prediction of second primary cancer in primary female non-metastatic breast cancer survivors | Aging