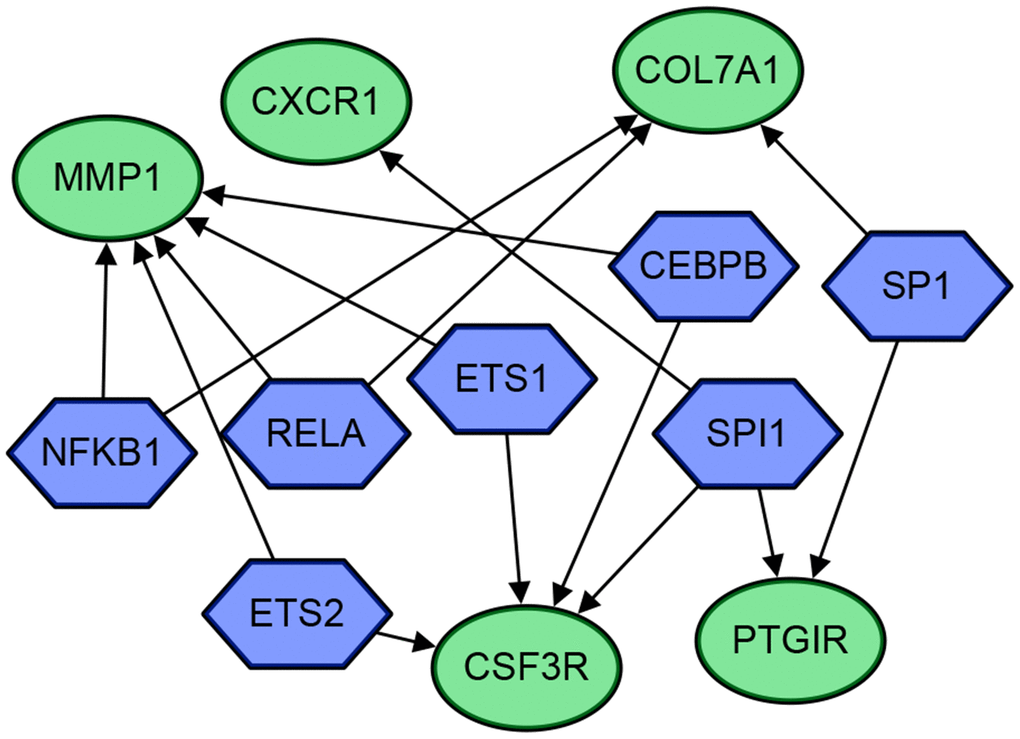
Figure 8.The gene regulatory network diagram of the 5 genes and 7 transcriptional regulators. The blue hexagons are transcriptional regulators, and the green circles are genes. The arrows indicate their regulatory relationships.
Figure 8 — Development of a susceptibility gene based novel predictive model for the diagnosis of ulcerative colitis using random forest and artificial neural network | Aging