Submit an Article
Navigate
Home
Editorial Board
Editorial Policies
Current Volume
Archive
Scientific Integrity
Publication Ethics Statements
Interviews with Outstanding Authors
Newsroom
Sponsored Conferences
Podcast
Contact
Special Collections
Submit an Article
Online ISSN: 1945-4589
Research Paper
|
Volume 12, Issue 19
|
pp. 18844–18852
Analysis of liver injury factors in 332 patients with COVID-19 in Shanghai, China
Back to article
Figure 1
(1 of 3)
−
100%
+
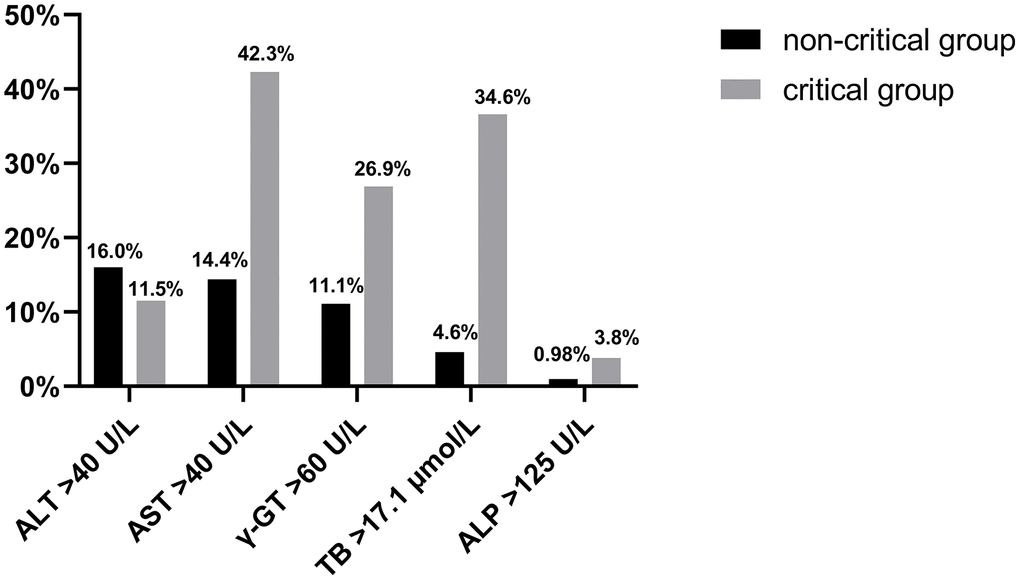
Figure 1.
The rate of ALT, AST, γ-GT, ALP, and TB abnormalities is shown in the critical and non-critical group.