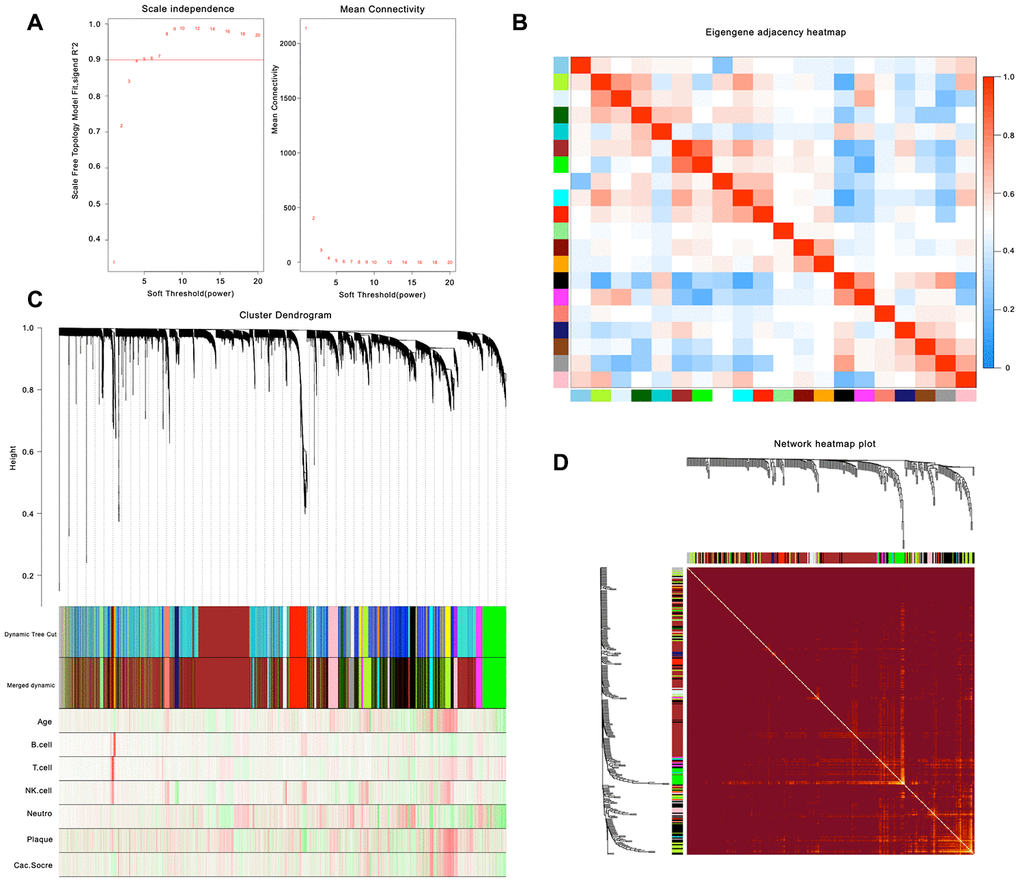
Figure 1.Weighted gene co-expression network analysis. (A) Analysis of network topology for various soft-thresholding powers. (B) Relationship among all the modules. (C) Clustering dendrogram of genes. Gene clustering tree (dendrogram) obtained by hierarchical clustering of adjacency-based dissimilarity. (D) Heatmap of the topological overlap in the gene network.