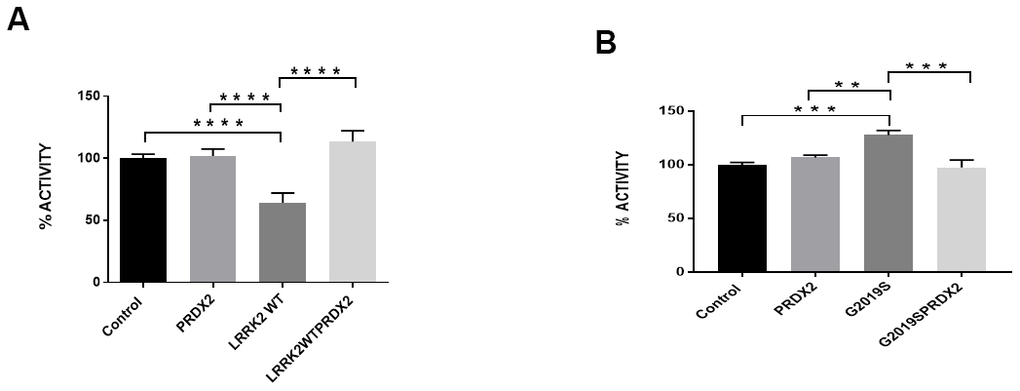
Figure 4.LRRK2 peroxidase activity. (A) Bar graph show LRRK2 WT peroxidase activity expressed as a percentage normalize to control. (B) Bar graph show G2019S peroxidase activity expressed as a percentage normalize to control. Significance indicated on the graph: *p<0.05, **p<0.01, ***p<0.001, ****p<0.0001.