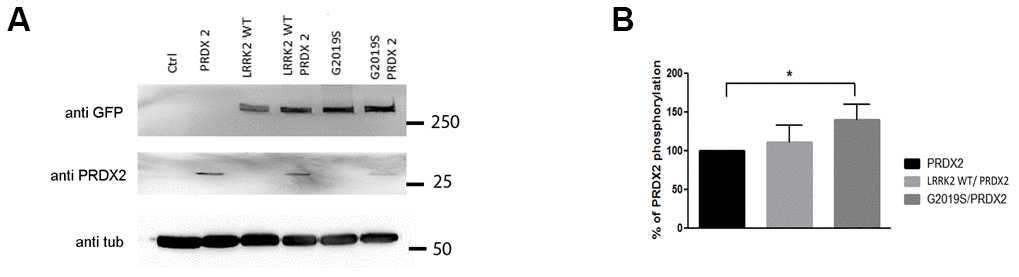
Figure 2.LRRK2 and PRDX2 transgenic flies. (A) LRRK2 GFP and PRDX2 expression driven by ddc-GAL-4 in transgenic fly head (B) Bar graphs show mean percentage and standard deviation of phosphorylation of PRDX2 in LRRK2 wildtype and G2019S flies (n = 3, cohort of 20).