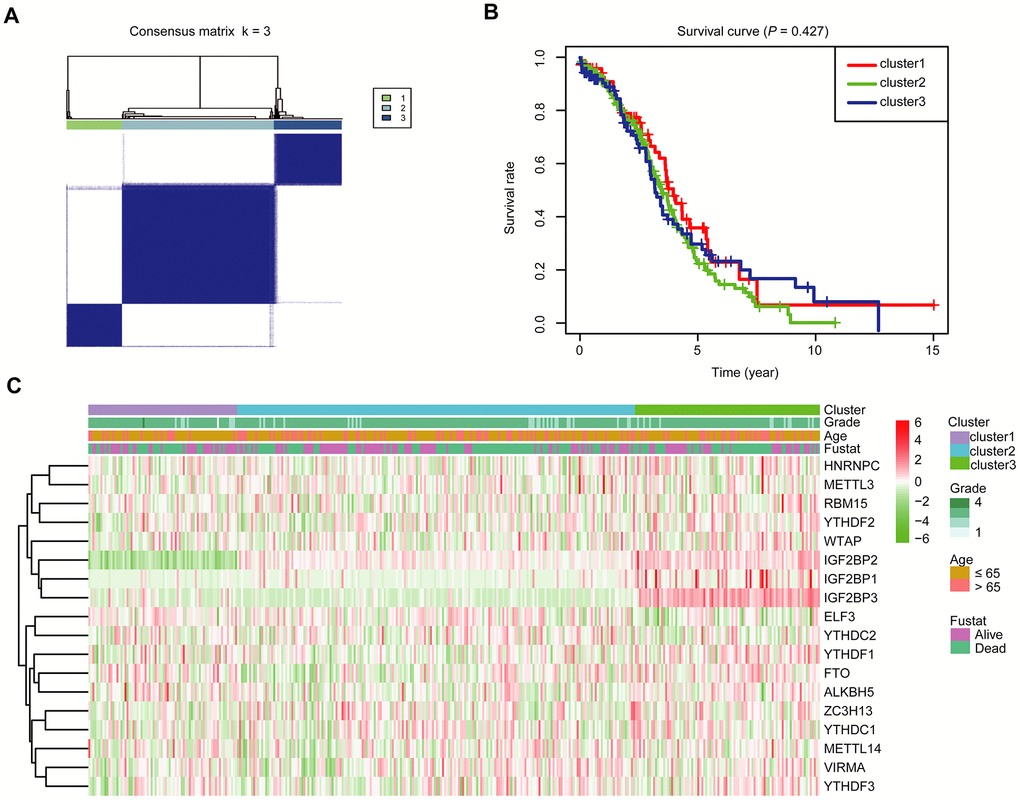
Figure 3.Divergent clinicopathological features and OS of OC in the cluster1/2/3 subgroups. (A) Consensus clustering matrix for k = 3. (B) Kaplan-Meier OS curves for 379 OC patients. (C) Heatmap and clinicopathologic characters of the three clusters (cluster1/2/3) defined by the m6A RNA methylation regulators’ consensus expression.