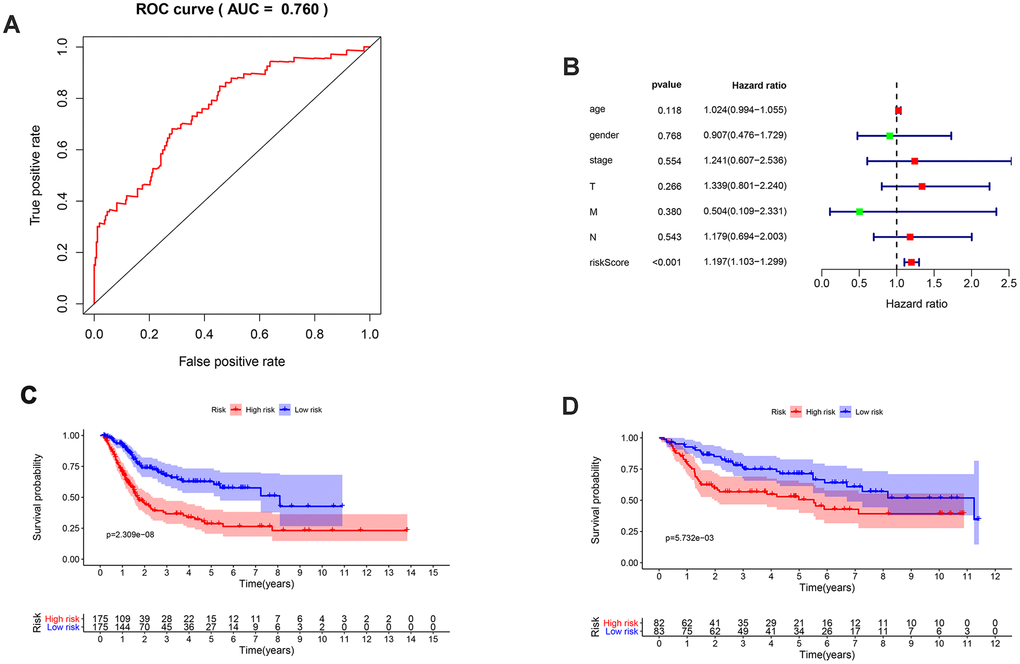
Figure 5.Validation of the prognosis signature and survival outcomes of different risk groups. (A) ROC curve of the prognosis signature with AUC equal to 0.760; (B) Multivariate Cox analysis of clinical parameters and risk score; (C) Kaplan-Meier survival curve of different risk groups of the TCGA database; (D) Kaplan-Meier survival curve of different risk groups of the GEO database in the form of cross validation.