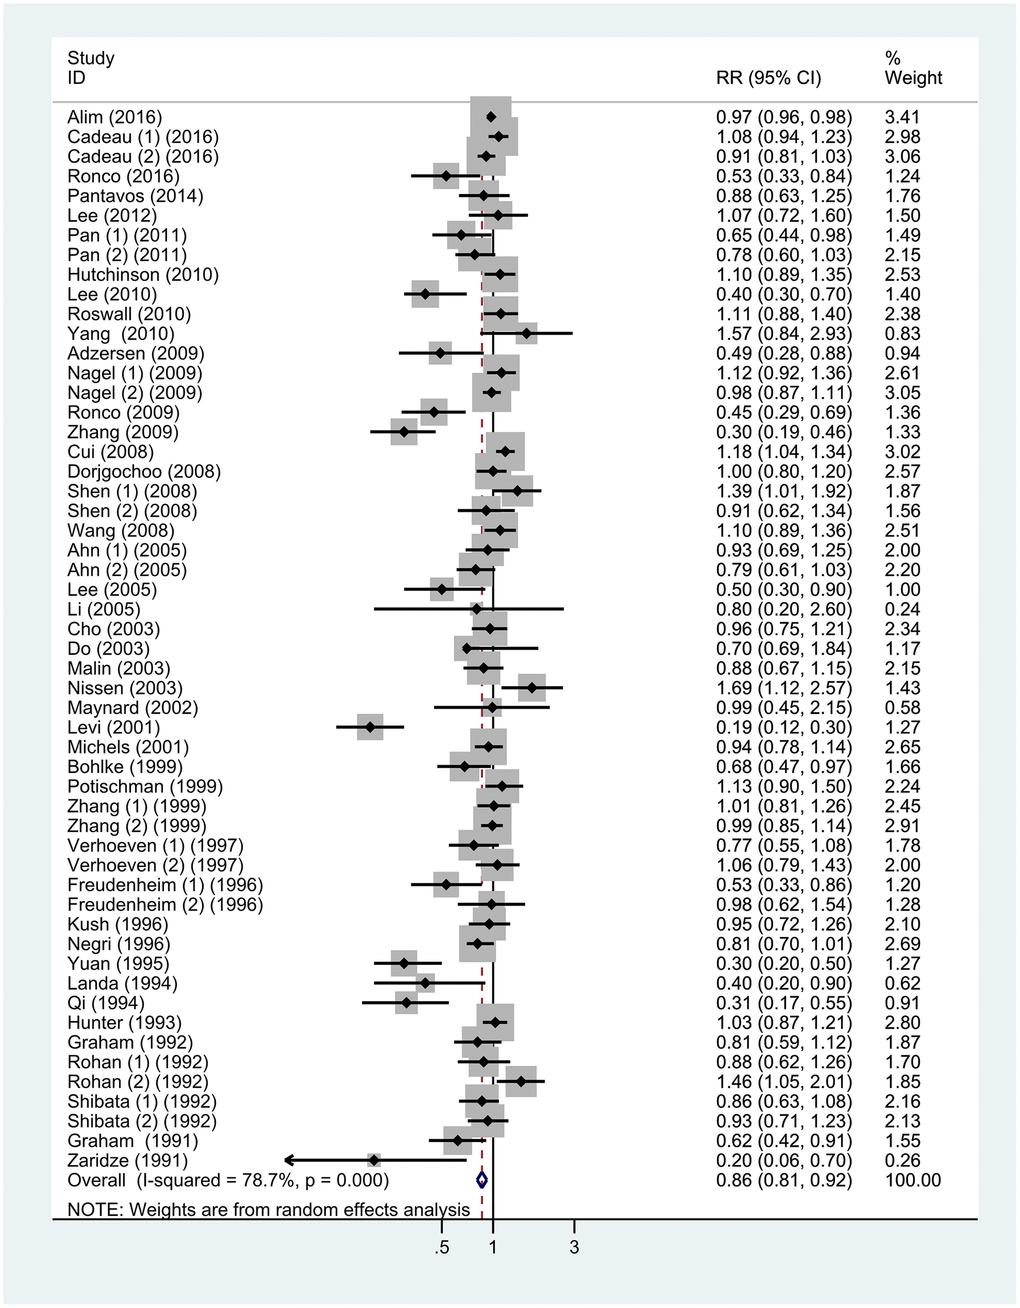
Figure 2.Forest plot of meta-analysis of breast cancer risk in relation to highest vs lowest categories of vitamin C intake. Note: Weights are from random-effects analysis. Abbreviations: RR, relative risk; CI, confidence interval.
Figure 2 — Association of vitamin C intake with breast cancer risk and mortality: a meta-analysis of observational studies | Aging