Submit an Article
Navigate
Home
Editorial Board
Editorial Policies
Current Volume
Archive
Scientific Integrity
Publication Ethics Statements
Interviews with Outstanding Authors
Newsroom
Sponsored Conferences
Podcast
Contact
Special Collections
Submit an Article
Online ISSN: 1945-4589
Research Paper
|
Volume 12, Issue 19
|
pp. 19159–19172
Transcriptomic analysis reveals a WNT signaling pathway-based gene signature prognostic for non-small cell carcinoma
Back to article
Figure 3
(3 of 5)
−
100%
+
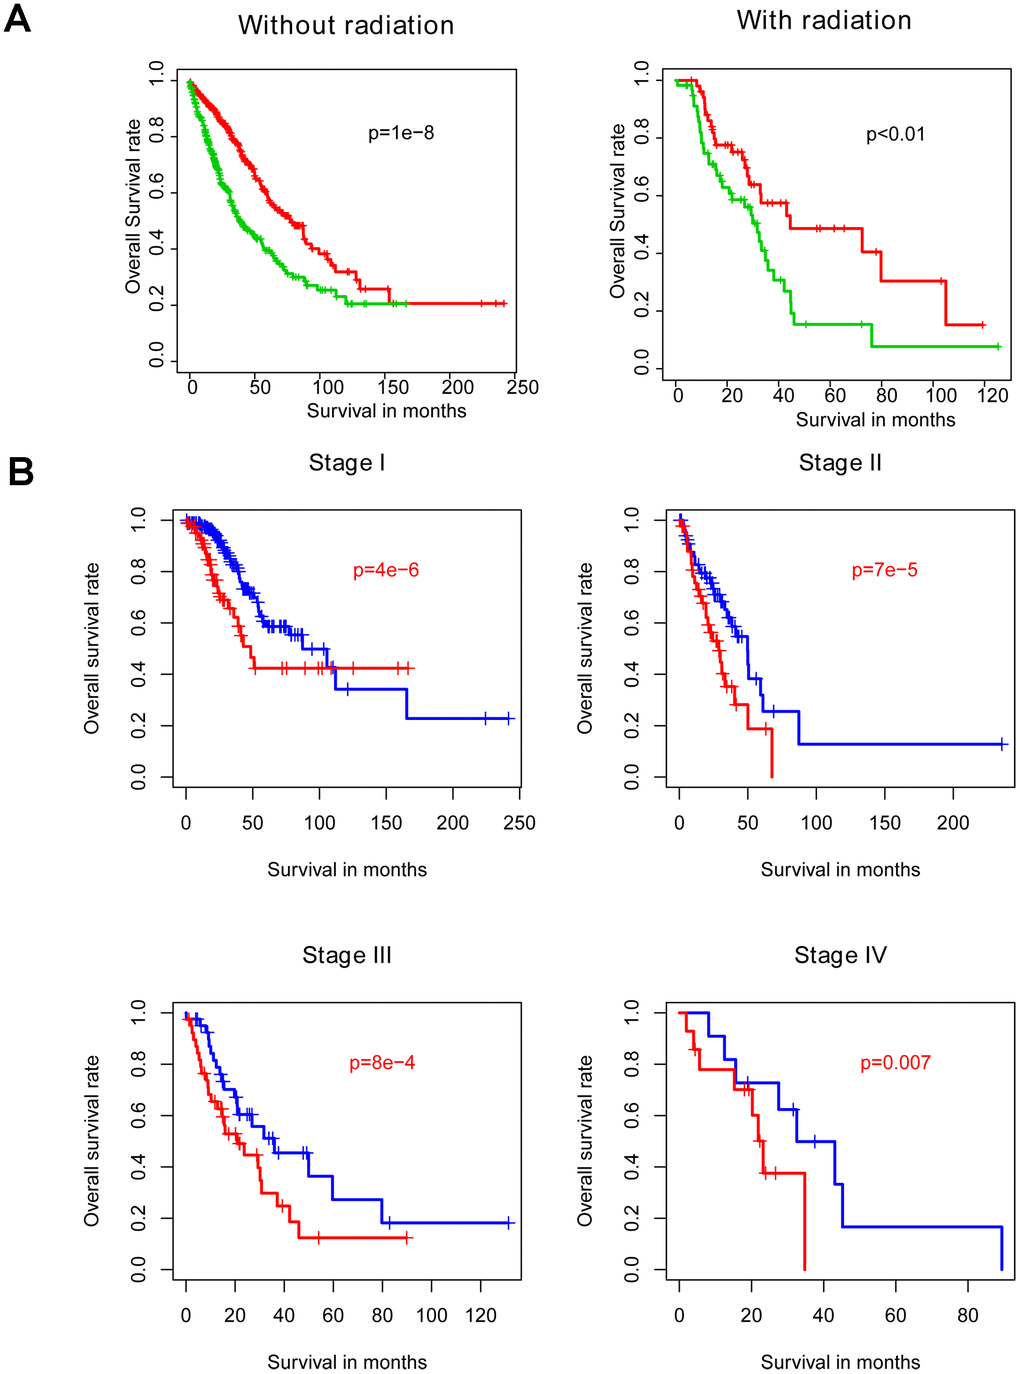
Figure 3.
Within-subgroup prognostic value of the risk score, for radiotherapy-treated and –untreated (
A
) samples, as well as for samples stratified by stage (
B
).