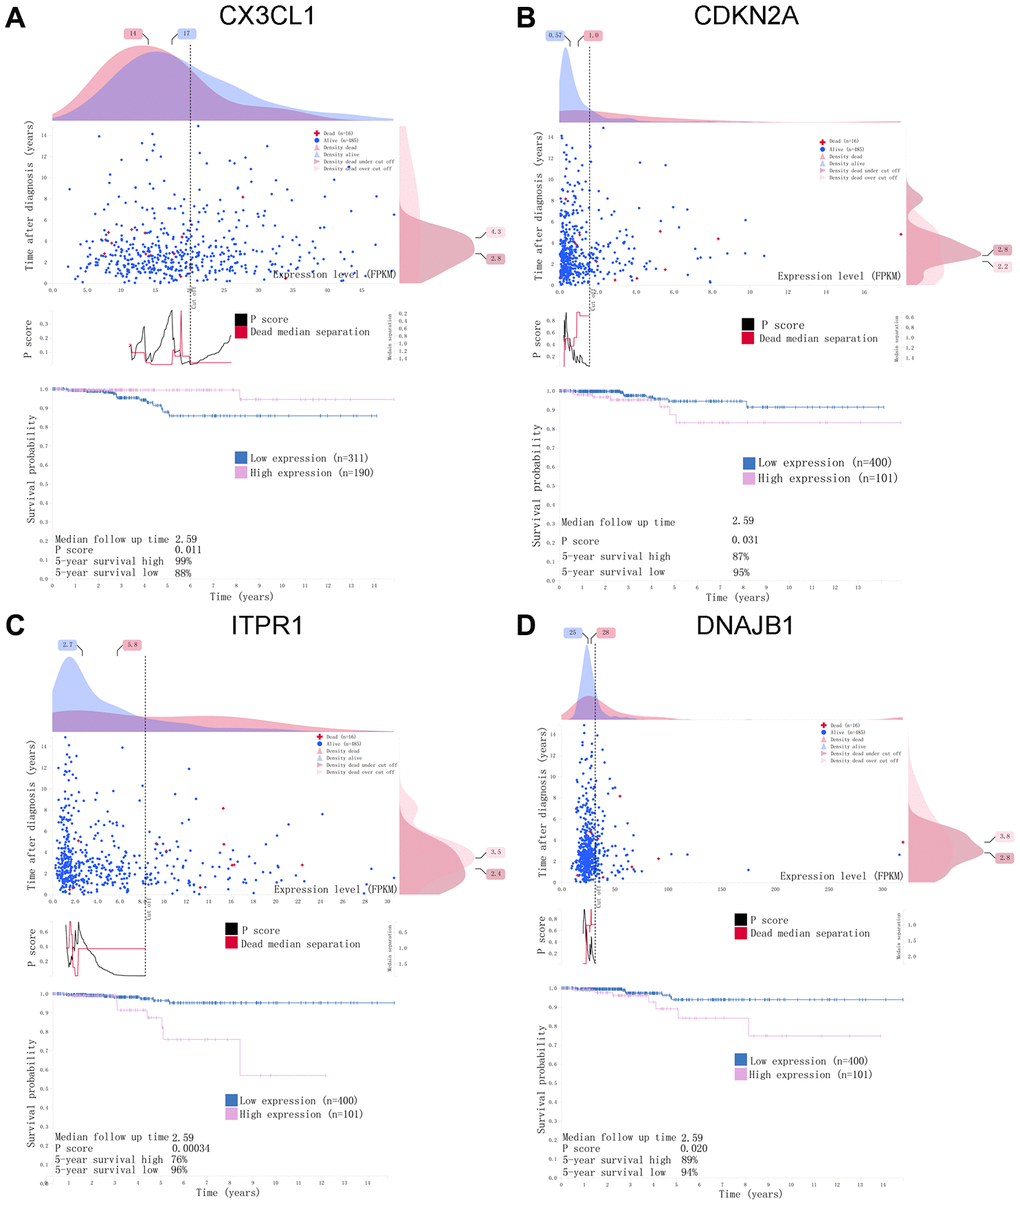
Figure 10.A horizontal distribution of events and gene expression in the Human Protein Atlas (HPA) database. Kaplan-Meier survival curves of (A) CX3CL1, (B) CDKN2A, (C) ITPR1, (D) DNAJB1 in THCA. The pink line indicates the high expression group, while the blue line indicates the low expression group. P <0.05 was set as the cutoff criterion.