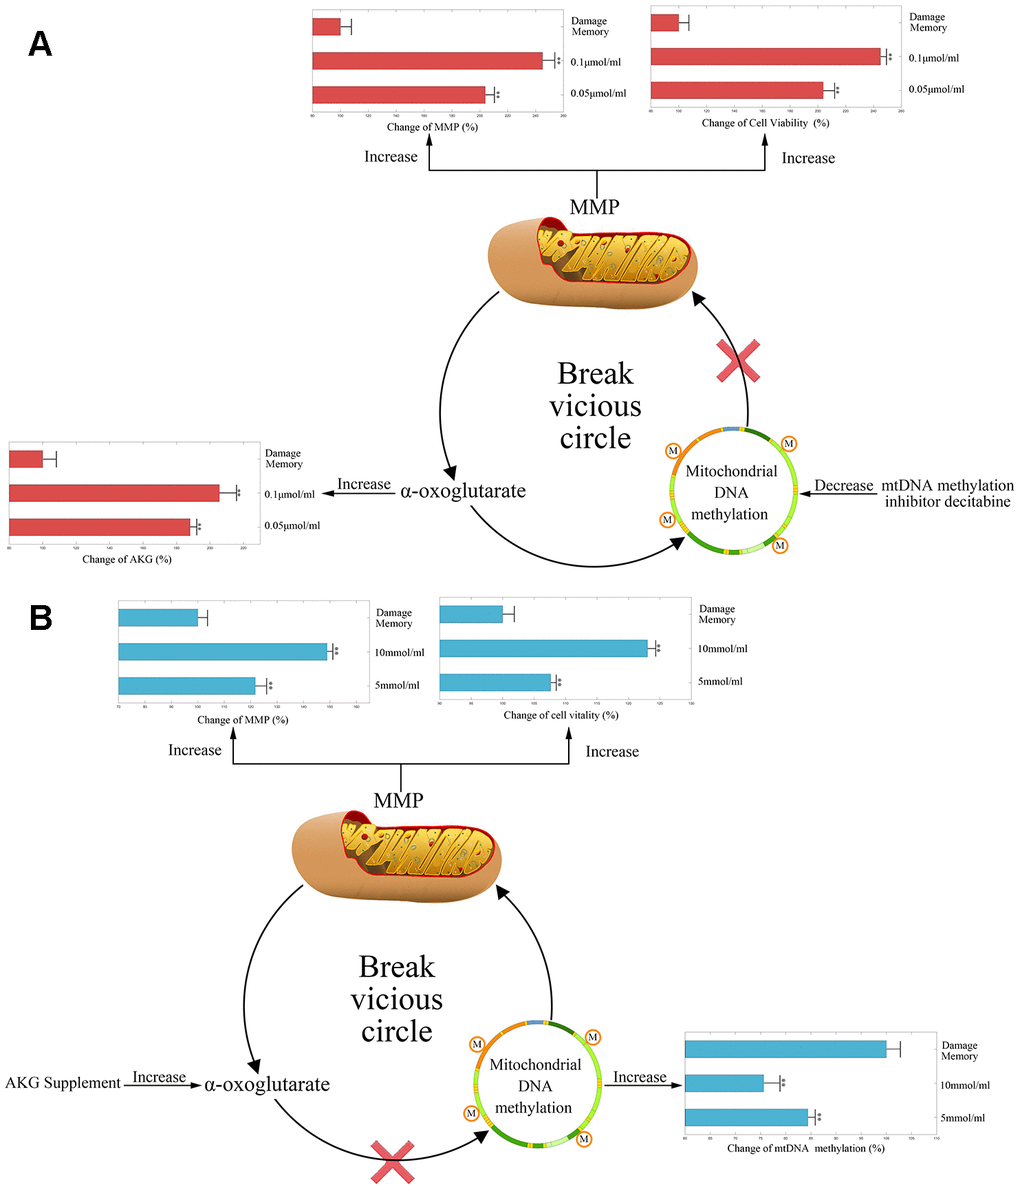
Figure 3.(A) The change of AKG, MMP, and cell vitality in decitabine treated hCMEC/D3 cell. The control group data is normalized to 100%. (B) The change of mtDNA methylation, MMP, and cell vitality in AKG treated hCMEC/D3 cell. The control group data is normalized to 100%. ** p<0.01 * p<0.05.