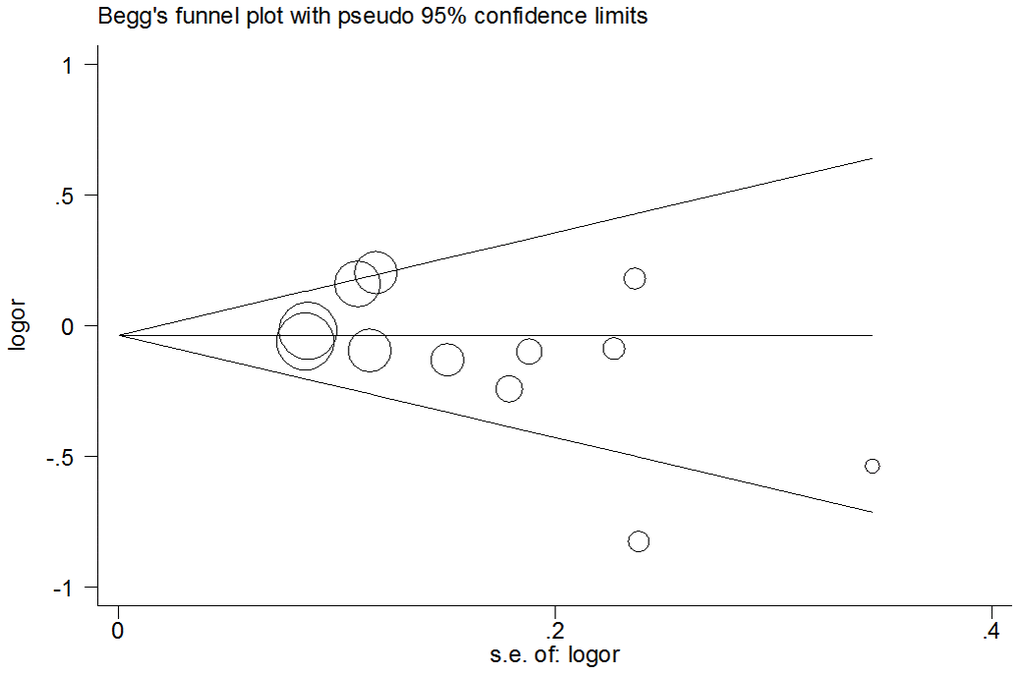
Figure 5.Funnel plot analysis to detect publication bias for over-dominant model of pri-miR-26a-1 rs7372209 C>T polymorphism. Circles represent the weight of the studies.
Figure 5 — Association between the pri-miR-26a-1 rs7372209 C>T polymorphism and cancer susceptibility: multivariate analysis and trial sequential analysis | Aging