Submit an Article
Navigate
Home
Editorial Board
Editorial Policies
Current Volume
Archive
Scientific Integrity
Publication Ethics Statements
Interviews with Outstanding Authors
Newsroom
Sponsored Conferences
Podcast
Contact
Special Collections
Submit an Article
Online ISSN: 1945-4589
Research Paper
|
Volume 12, Issue 16
|
pp. 16341–16356
Abnormal static and dynamic functional connectivity of resting-state fMRI in multiple system atrophy
Back to article
Figure 1
(1 of 7)
−
100%
+
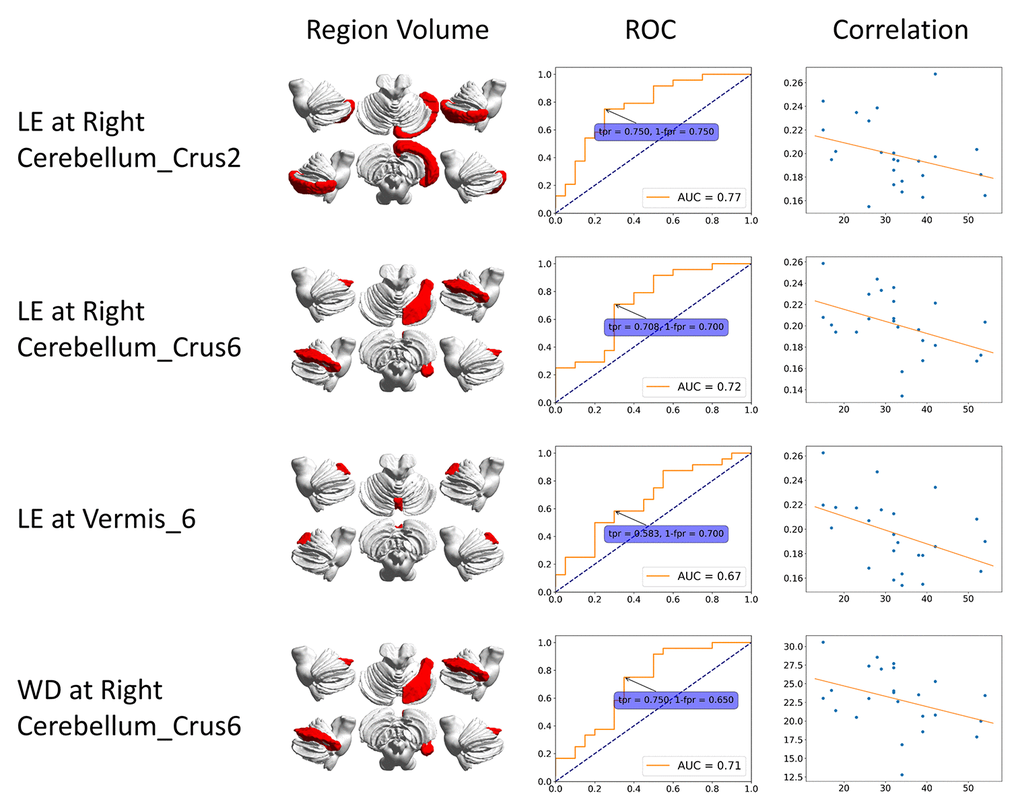
Figure 1.
ROC curve and correlation of static features.
The correlation is between clinical score (x-axis) and features (y-axis). BC: betweenness centrality; CCFS: clustering coefficient; LE: local efficiency; WD: weighted degree.