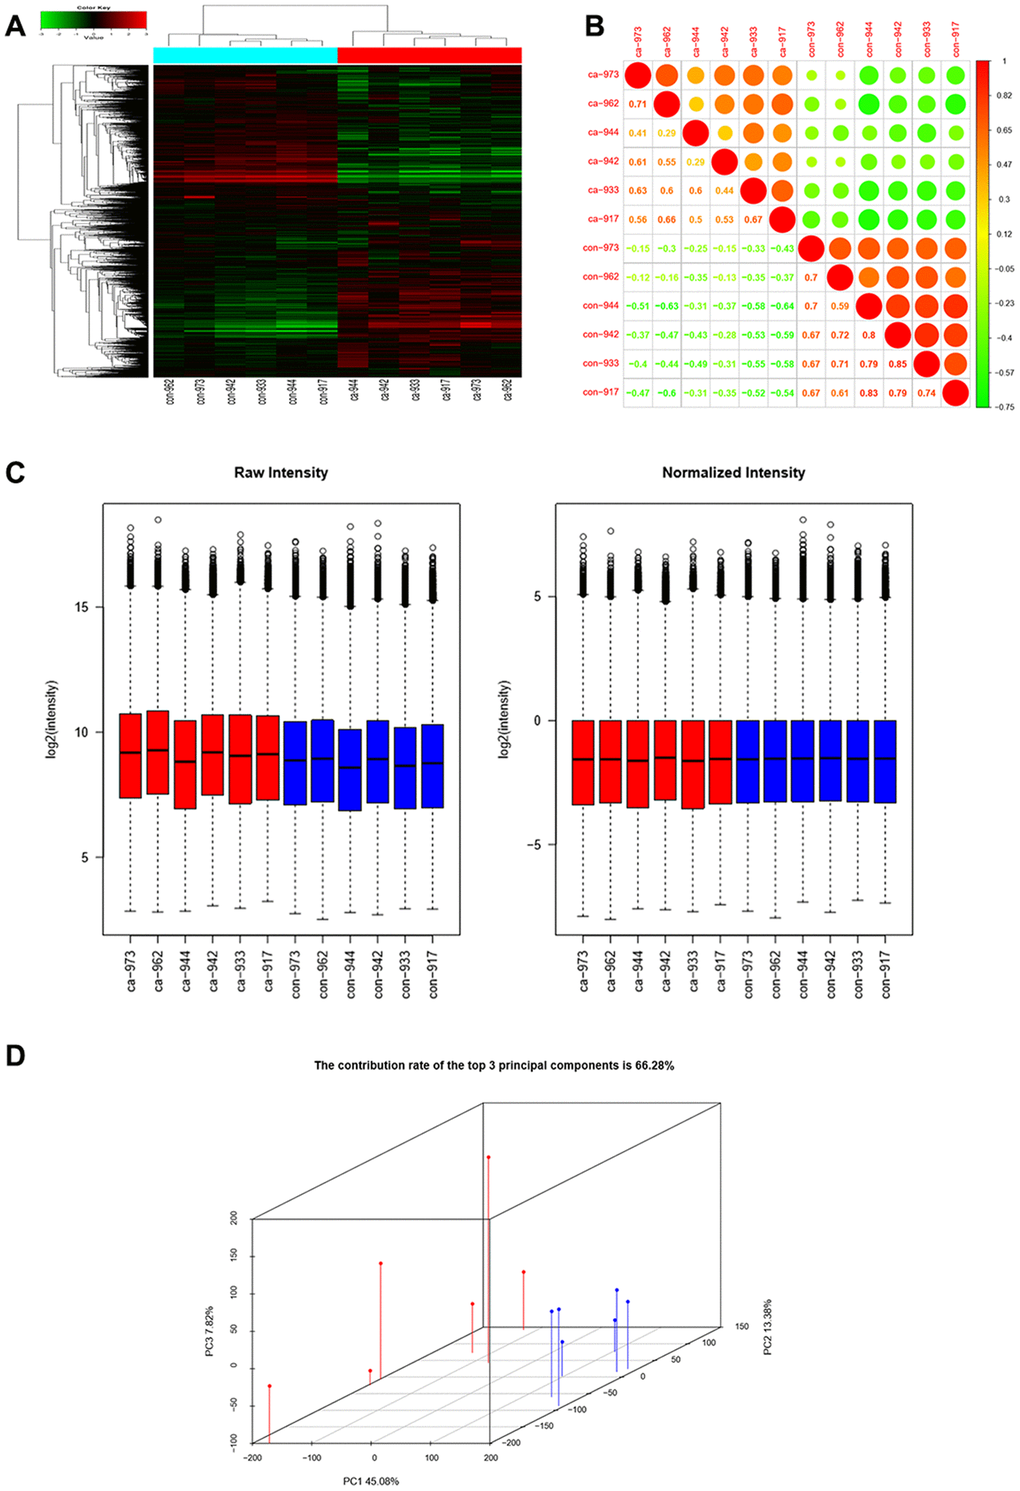
Figure 1.CircRNAs expression profiles in ESCC and adjacent normal tissues. (A) Hierarchical clustering showed that a large number of circRNAs were expressed in two groups. (B) Correlation analysis showed a high correlation of samples. (C) Box plots showed that samples had comparable intensities. (D) Three-dimensional principal component analysis (PCA 3D) indicated high similarity of samples.