Submit an Article
Navigate
Home
Editorial Board
Editorial Policies
Current Volume
Archive
Scientific Integrity
Publication Ethics Statements
Interviews with Outstanding Authors
Newsroom
Sponsored Conferences
Podcast
Contact
Special Collections
Submit an Article
Online ISSN: 1945-4589
Research Paper
|
Volume 12, Issue 17
|
pp. 17062–17078
Evidence that dysplasia related microRNAs in Barrett’s esophagus target PD-L1 expression and contribute to the development of esophageal adenocarcinoma
Back to article
Figure 5
(5 of 5)
−
100%
+
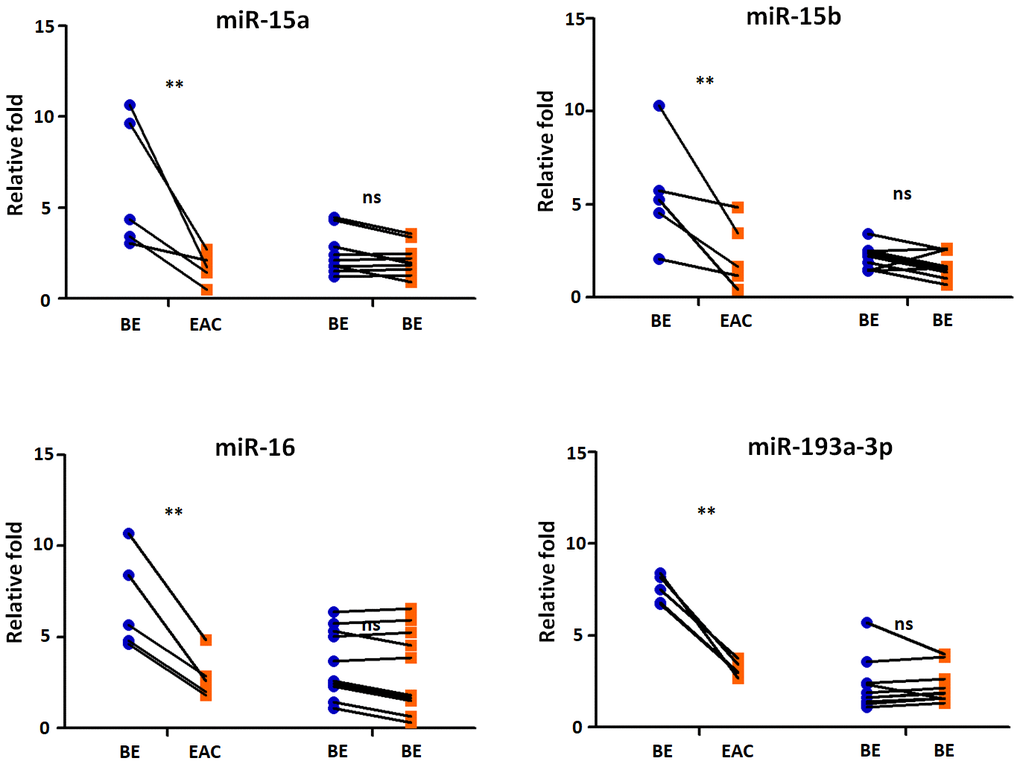
Figure 5.
Exosomal miRNAs expression correlates with BE-EAC progression.
TaqMan real-time RT-PCR to validate the expression levels of miR-15a, -15b, -16, and -193a-3p using 5 BE-EAC patients and 10 BE-BE patients. Data shown are as mean ± SD.