Submit an Article
Navigate
Home
Editorial Board
Editorial Policies
Current Volume
Archive
Scientific Integrity
Publication Ethics Statements
Interviews with Outstanding Authors
Newsroom
Sponsored Conferences
Podcast
Contact
Special Collections
Submit an Article
Online ISSN: 1945-4589
Research Paper
|
Volume 12, Issue 17
|
pp. 16899–16920
Umbilical cord mesenchymal stem cells protect thymus structure and function in aged C57 mice by downregulating aging-related genes and upregulating autophagy- and anti-oxidative stress-related genes
Back to article
Figure 2
(2 of 22)
−
100%
+
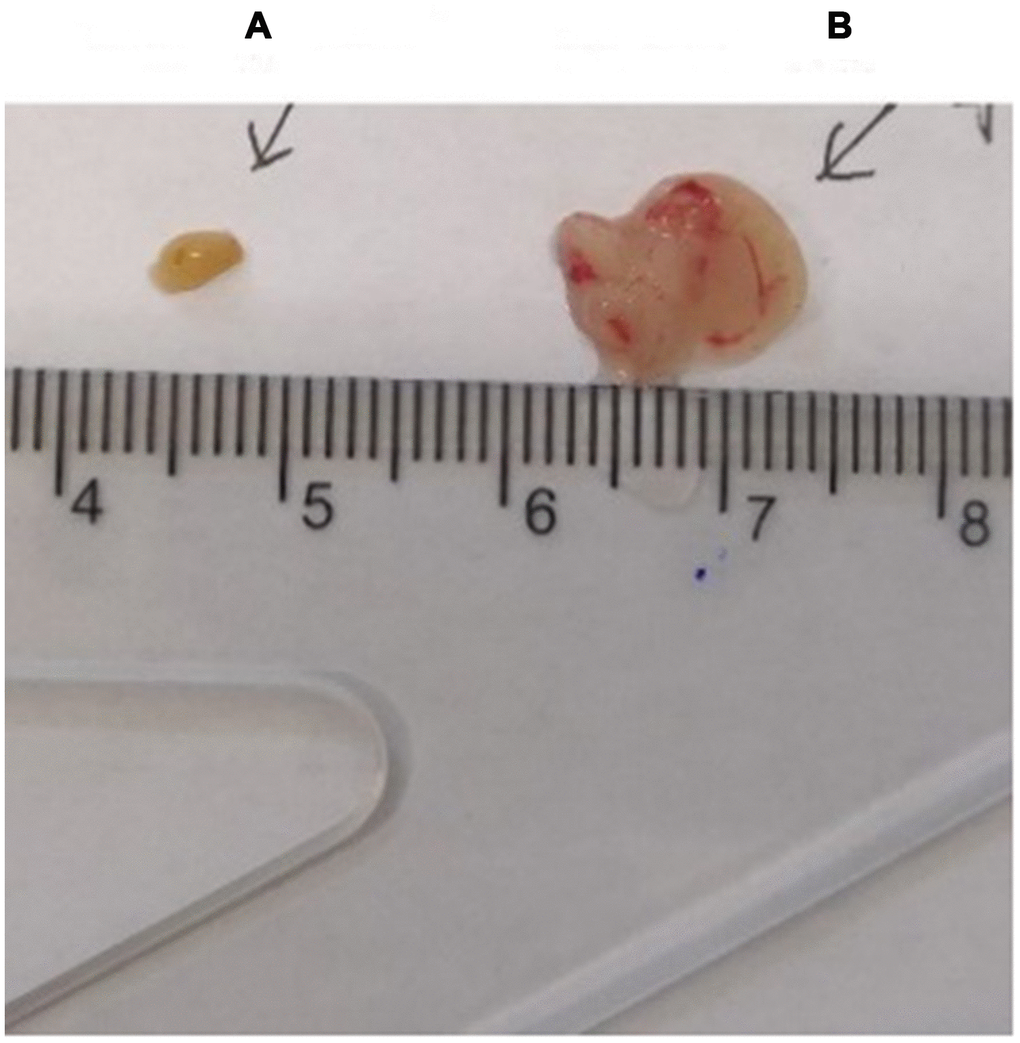
Figure 2.
Comparison of the thymus in C57 mice of different ages.
(
A
) model control group; (
B
) young control group.