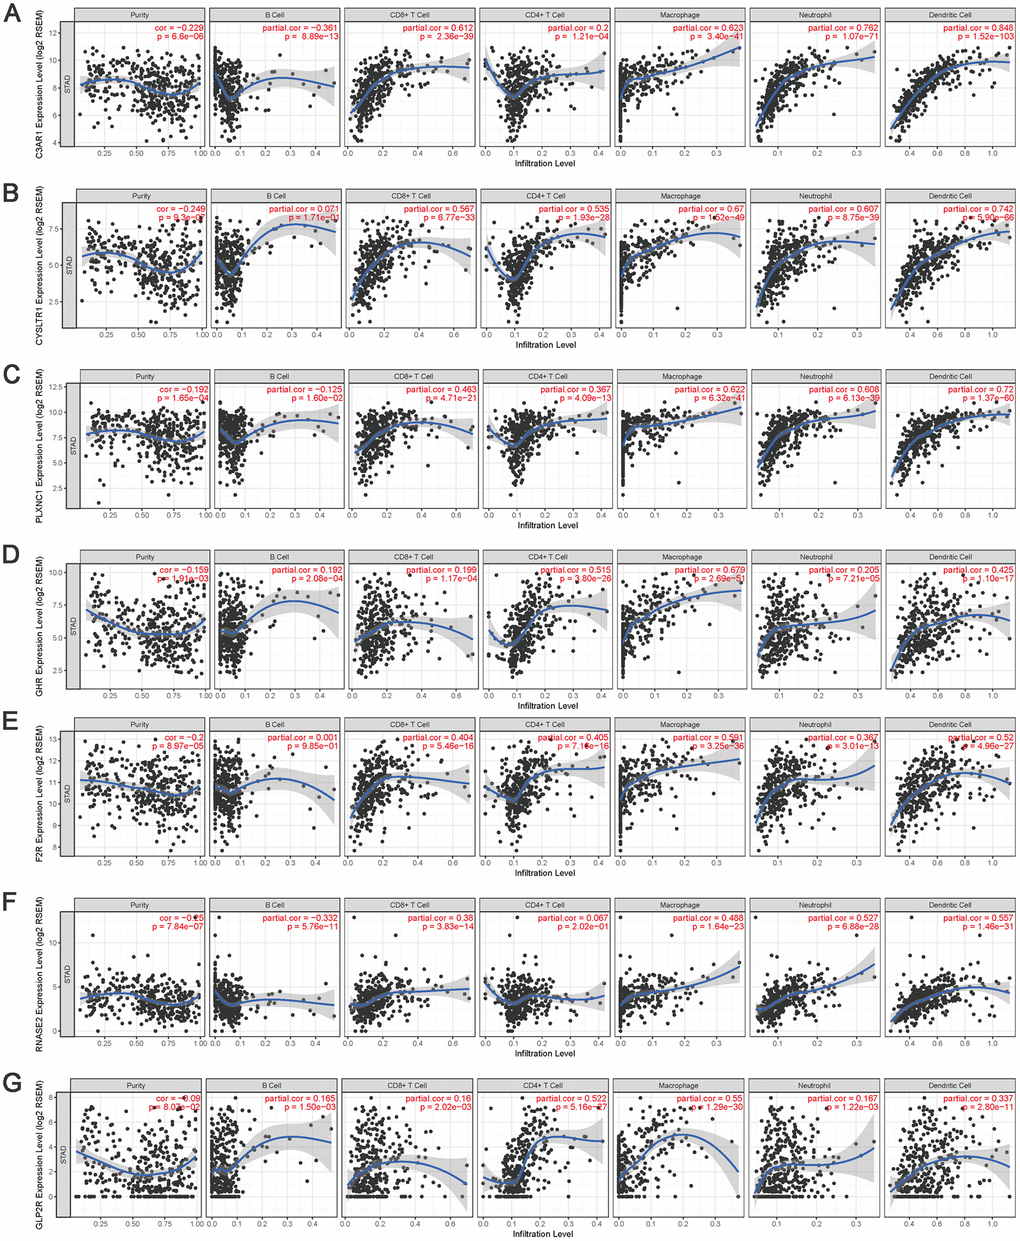
Figure 14.The correlation between the hub IRGs and TIICs. The expression levels of C3AR1 (A) CYSLTR1 (B) PLXNC1 (C) GHR (D) F2R (E) RNASE2 (F) and GLP2R (G) and their associations with the infiltration levels of immune cells.
Figure 14 — Prognostic landscape of tumor-infiltrating immune cells and immune-related genes in the tumor microenvironment of gastric cancer | Aging