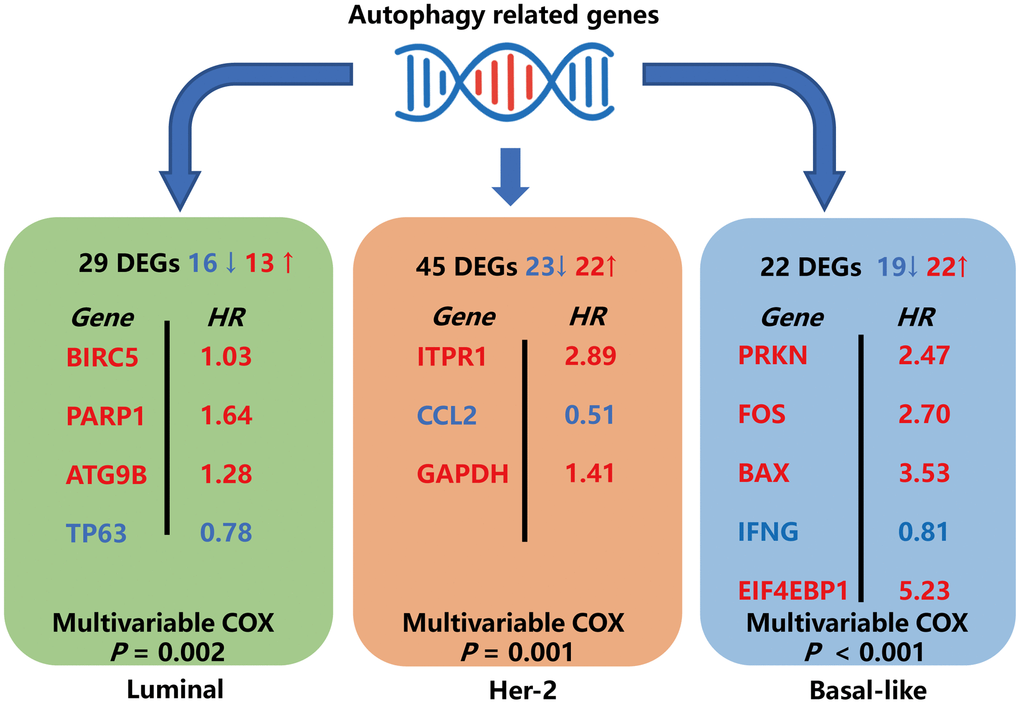
Figure 12.Schematic summary diagram for the three subtype-specific risk-models constructed in this study.
Figure 12 — Subtype-specific risk models for accurately predicting the prognosis of breast cancer using differentially expressed autophagy-related genes | Aging