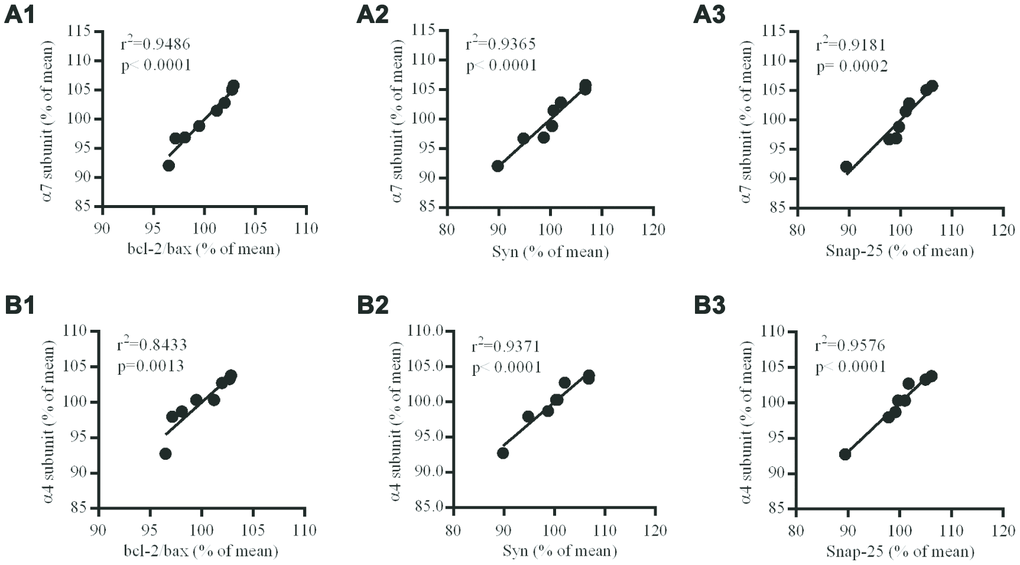
Figure 8.Correlation between nAChR subunits and Bcl-2/Bax ratio, Syn or Snap-25 in the hippocampus of db/db mouse brains. (A1–3) the correlation between α7 and Bcl-2/Bax, Syn or Snap-25; (B1–3) the correlation between α4 and Bcl-2/Bax, Syn or Snap-25. The values presented are mean ± SEM (n=8) as determined with the Pearson correlation test.