Submit an Article
Navigate
Home
Editorial Board
Editorial Policies
Current Volume
Archive
Scientific Integrity
Publication Ethics Statements
Interviews with Outstanding Authors
Newsroom
Sponsored Conferences
Podcast
Contact
Special Collections
Submit an Article
Online ISSN: 1945-4589
Research Paper
|
Volume 12, Issue 13
|
pp. 13090–13114
Changes of saliva microbiota in the onset and after the treatment of diabetes in patients with periodontitis
Back to article
Figure 4
(5 of 6)
−
100%
+
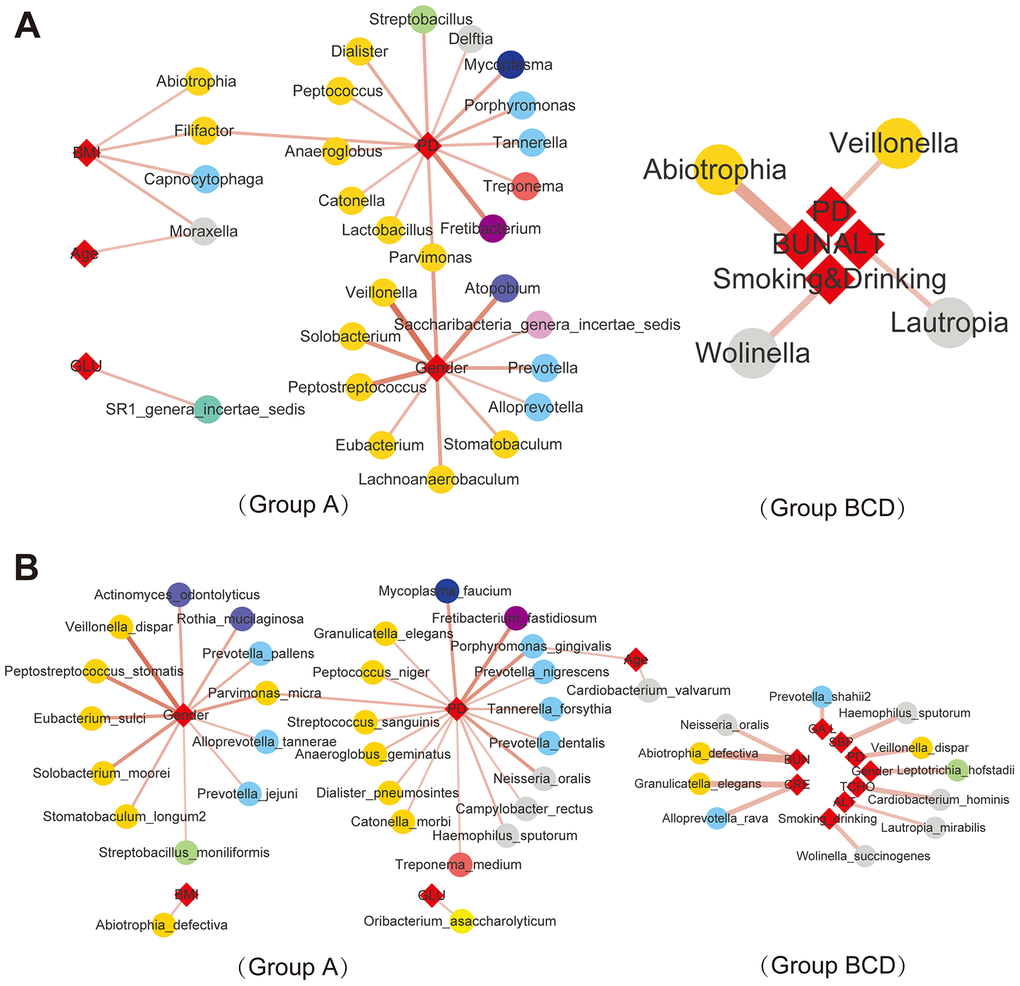
Figure 4.
Correlations between salivary bacteria and clinical parameters.
|Spearman correlation| ≥0.7 and q value≤0.01 analysis of the salivary microbiota at the genus (
A
) and species (
B
) levels with the abundance ≥ 0.02%.