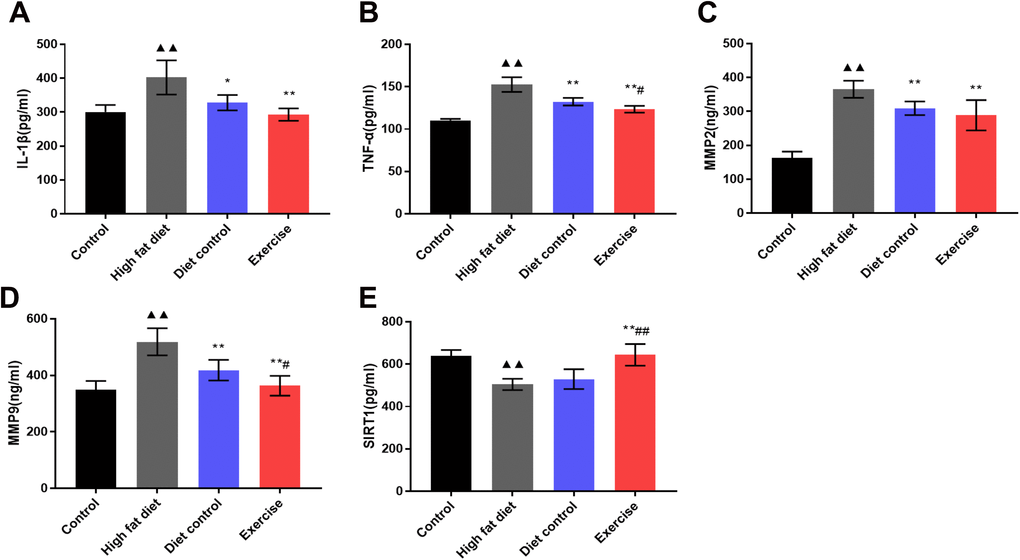
Figure 3.Serum IL-1β, TNFα, MMP-2, MMP-9 and SIRT1 expression. (A) The levels of IL-1β in serum. (B) The levels of TNFα in serum. (C) The levels of MMP-2 in serum. (D) The levels of MMP-9 in serum. vs control group, (E) The levels of SIRT1 in serum. ▲▲p < 0.01. vs HFD group, *p < 0.05, **p < 0.01. vs DC group, #p < 0.05.