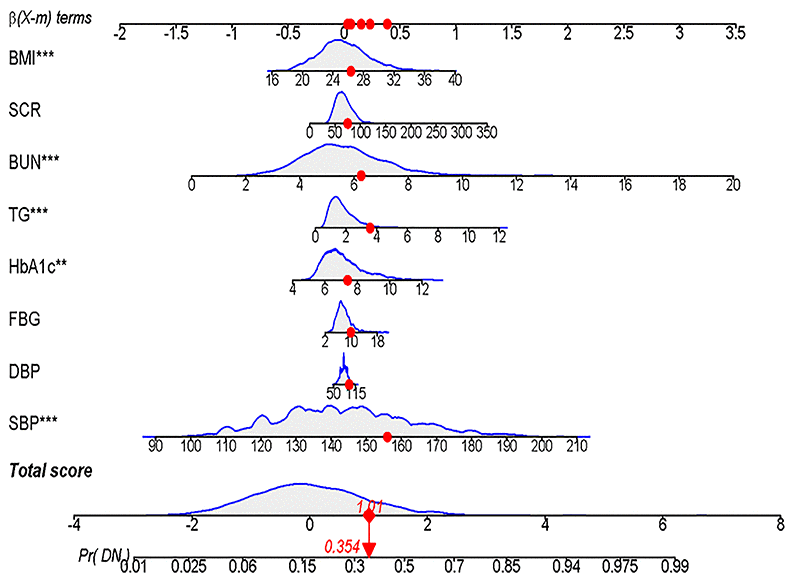
Figure 8.Dynamic Nomogram. A T2DM patient was randomly selected from the population, and the DN incidence of the patient was predicted based on the 8 characteristic indicators of the nomogram.
Figure 8 — Nomogram for the prediction of diabetic nephropathy risk among patients with type 2 diabetes mellitus based on a questionnaire and biochemical indicators: a retrospective study | Aging