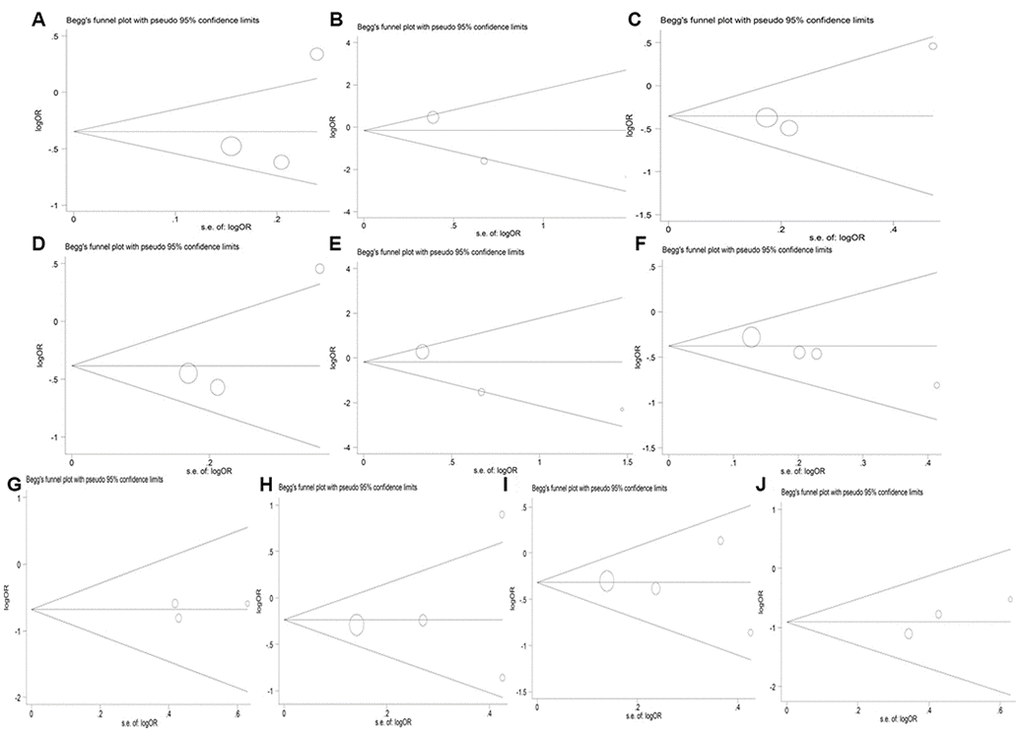
Figure 9.Begg’s funnel plot for studies of the HIF1A Pro582Ser genetic polymorphism in diabetes risk under the allelic (A), homozygous (B), heterozygous (C), dominant (D) and recessive (E) genetic model, and in risk of diabetic complications under the allelic (F), homozygous (G), heterozygous (H), dominant (I) and recessive (J) genetic model.