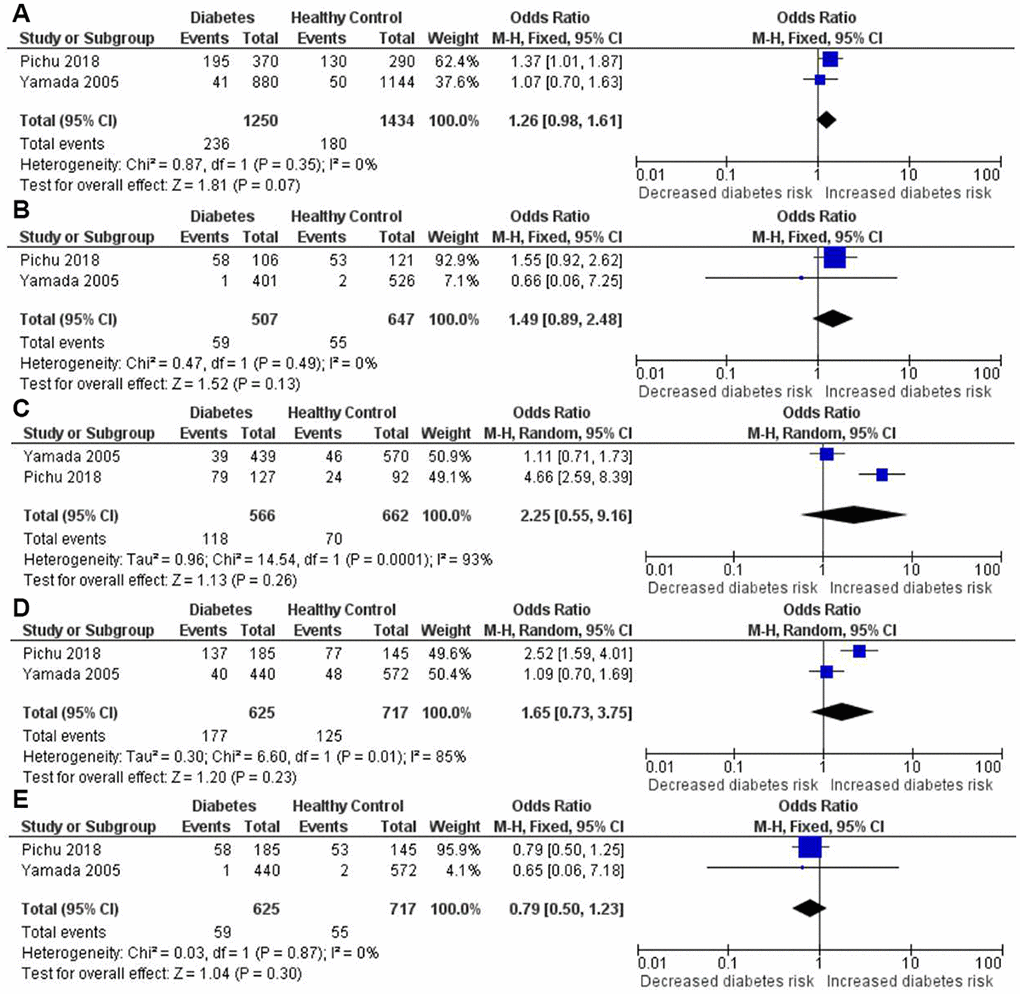
Figure 7.Forest plot of the meta-analysis for association between the HIF1A Ala588Thr genetic polymorphism and diabetes risk under the allelic (A), homozygous (B), heterozygous (C), dominant (D) and recessive (E) genetic model.
Figure 7 — Genetic association of hypoxia inducible factor 1-alpha (HIF1A) Pro582Ser polymorphism with risk of diabetes and diabetic complications | Aging