Submit an Article
Navigate
Home
Editorial Board
Editorial Policies
Current Volume
Archive
Scientific Integrity
Publication Ethics Statements
Interviews with Outstanding Authors
Newsroom
Sponsored Conferences
Podcast
Contact
Special Collections
Submit an Article
Online ISSN: 1945-4589
Research Paper
|
Volume 12, Issue 13
|
pp. 12783–12798
Genetic association of hypoxia inducible factor 1-alpha (
HIF1A
) Pro582Ser polymorphism with risk of diabetes and diabetic complications
Back to article
Figure 4
(4 of 9)
−
100%
+
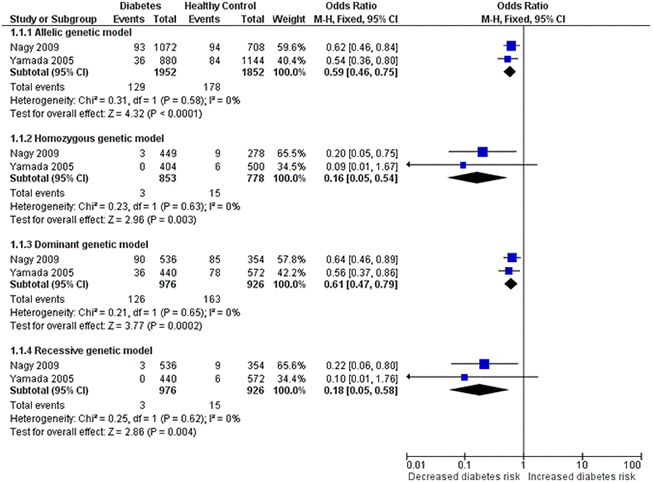
Figure 4.
Forest plot for the meta-analysis of association of the
HIF1A
Pro582Ser genetic polymorphism with risk of diabetes after omitting the outlier under the allelic (
A
), homozygous (
B
), dominant (
C
) and recessive (
D
) genetic model.