Submit an Article
Navigate
Home
Editorial Board
Editorial Policies
Current Volume
Archive
Scientific Integrity
Publication Ethics Statements
Interviews with Outstanding Authors
Newsroom
Sponsored Conferences
Podcast
Contact
Special Collections
Submit an Article
Online ISSN: 1945-4589
Research Paper
|
Volume 12, Issue 13
|
pp. 12783–12798
Genetic association of hypoxia inducible factor 1-alpha (
HIF1A
) Pro582Ser polymorphism with risk of diabetes and diabetic complications
Back to article
Figure 1
(1 of 9)
−
100%
+
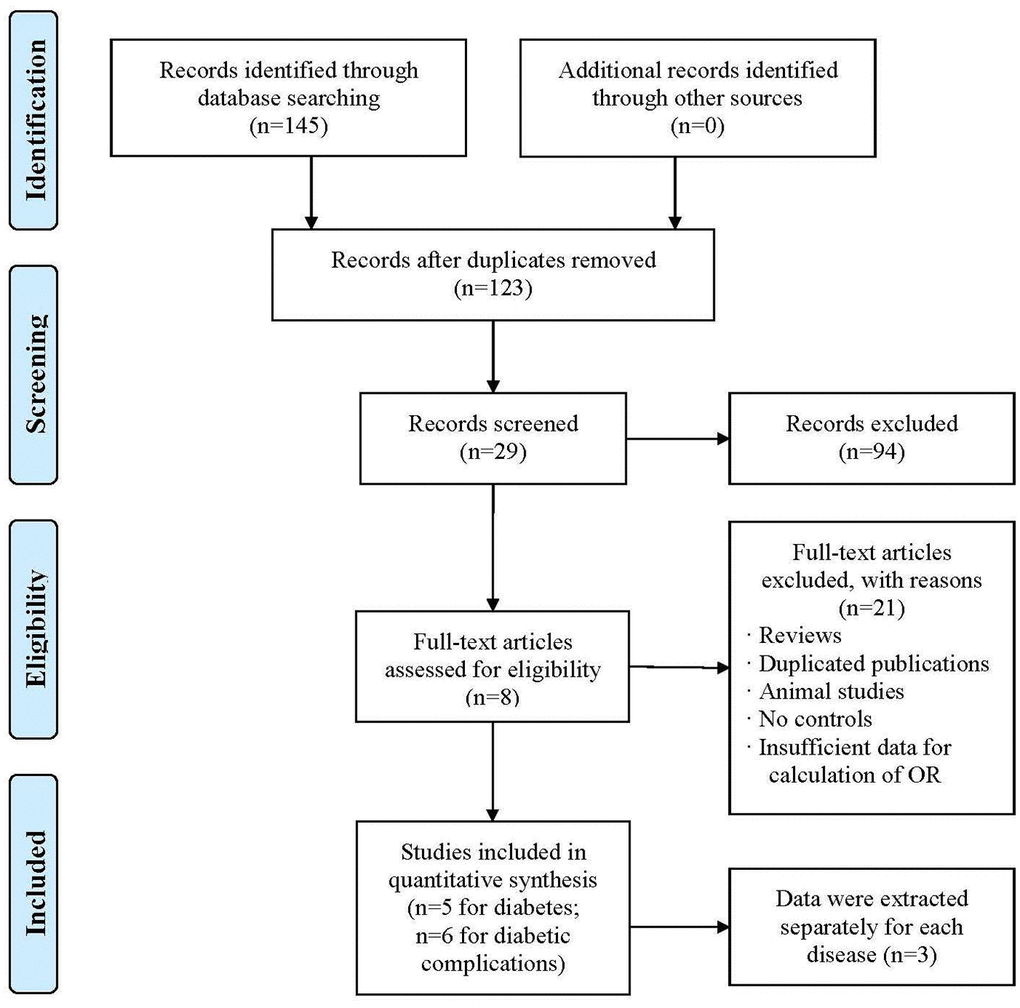
Figure 1.
Flow diagram of the search strategy and study selection. The terms “n” in the boxes represent the number of corresponding studies.