Submit an Article
Navigate
Home
Editorial Board
Editorial Policies
Current Volume
Archive
Scientific Integrity
Publication Ethics Statements
Interviews with Outstanding Authors
Newsroom
Sponsored Conferences
Podcast
Contact
Special Collections
Submit an Article
Online ISSN: 1945-4589
Research Paper
|
Volume 12, Issue 9
|
pp. 8484–8505
Identification of transforming growth factor beta induced (TGFBI) as an immune-related prognostic factor in clear cell renal cell carcinoma (ccRCC)
Back to article
Figure 12
(12 of 15)
−
100%
+
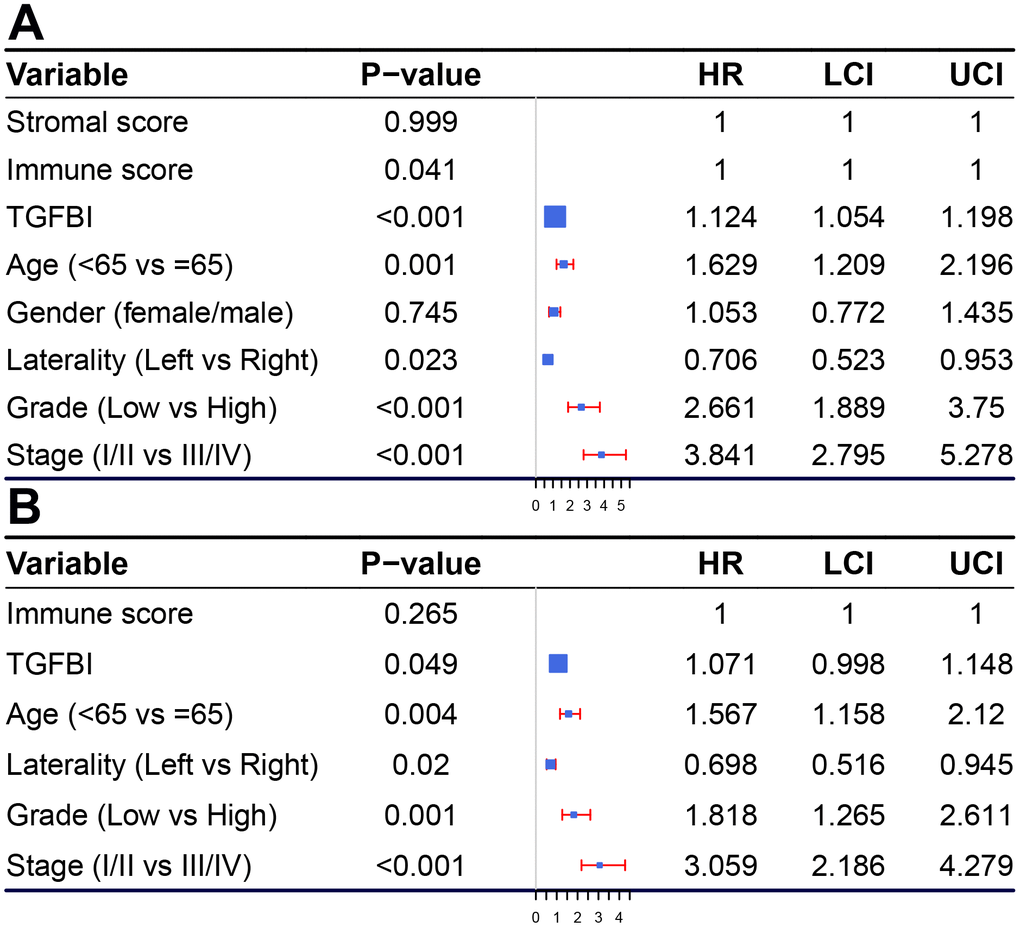
Figure 12.
Forest plot summary of analyses of OS.
Univariable (
A
) and multivariable analyses (
B
) of the stromal score, immune score, TGFBI, age, gender, grade, laterality, and tumor stage on all 530 patients.