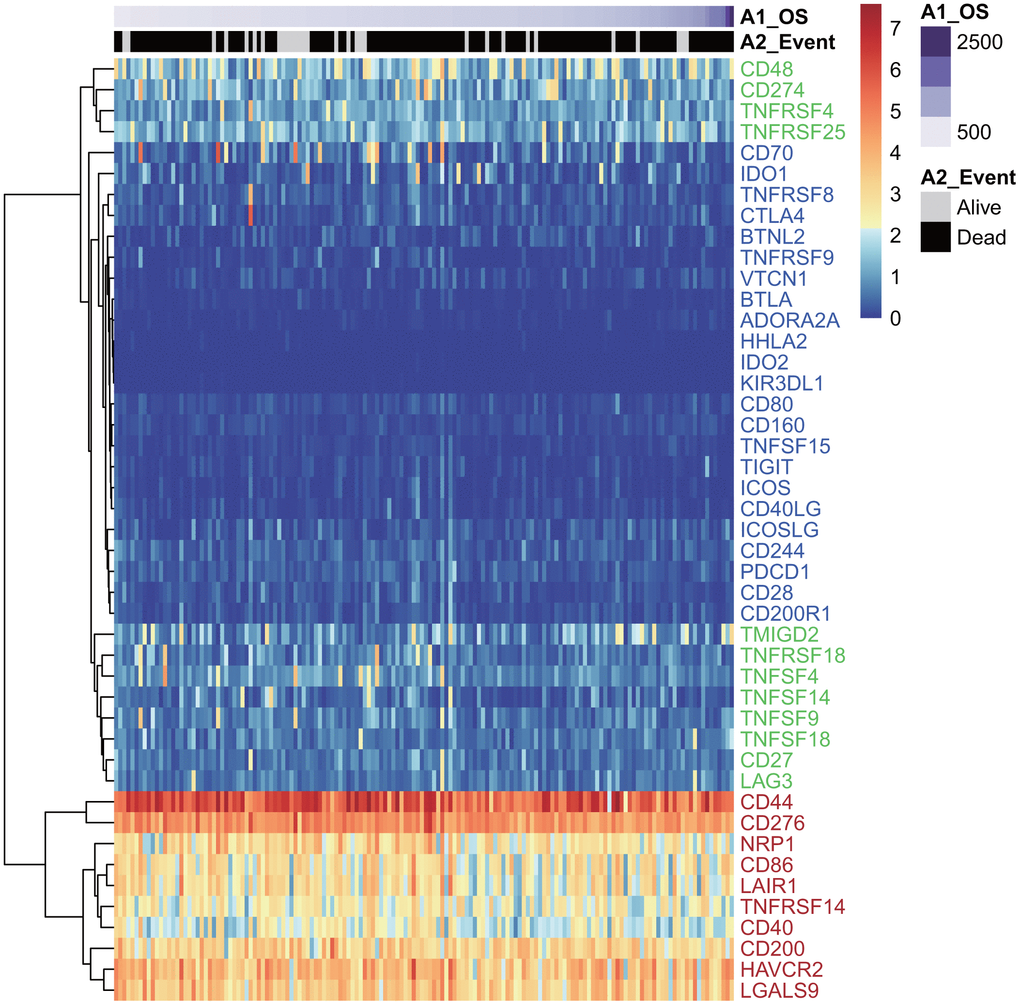
Figure 1.The heatmap of ICG expression in the TCGA-GBM dataset. Red indicates the high expression group; green indicates the moderate expression group; blue indicates the low expression group.
Figure 1 — Identification of immunologic subtype and prognosis of GBM based on TNFSF14 and immune checkpoint gene expression profiling | Aging