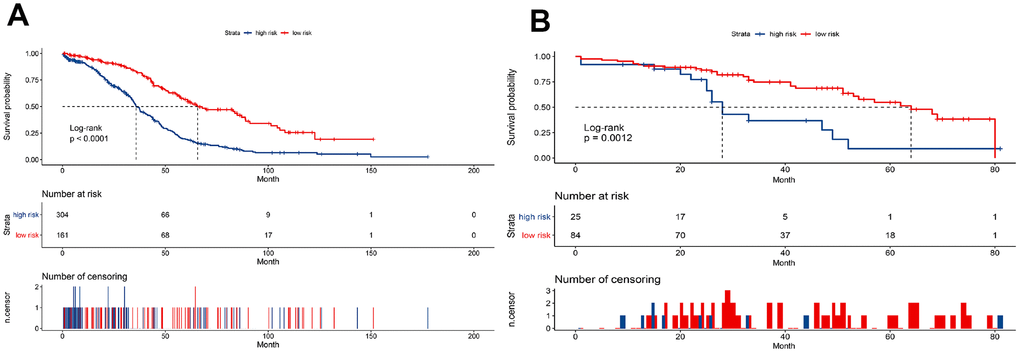
Figure 4.Kaplan-Meier curves to compare overall survival of high-risk and low-risk groups based on the nine-gene signature in the training cohort (A) and validation cohort (B).
Figure 4 — A nine-gene signature related to tumor microenvironment predicts overall survival with ovarian cancer | Aging