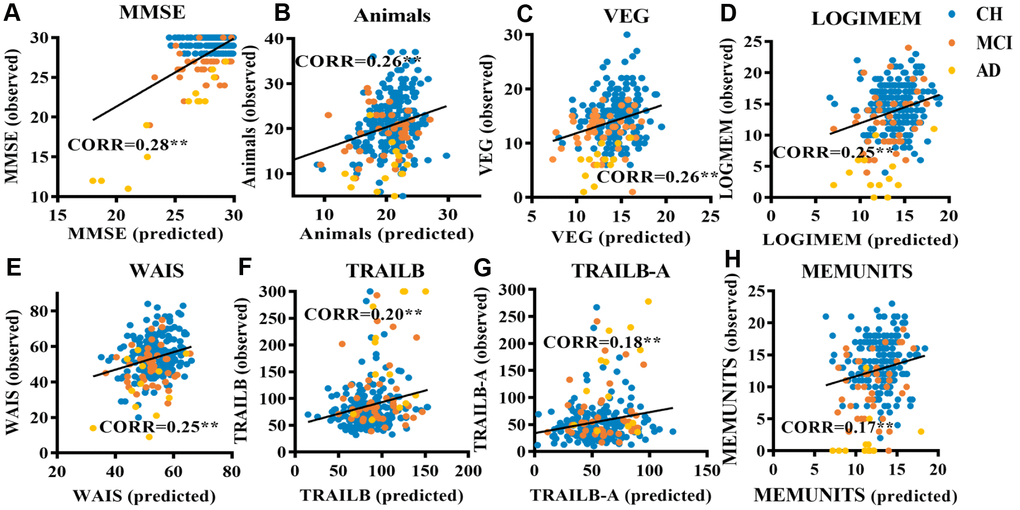
Figure 1.Scatter plots relating cognitive performance predicted using a RVR model based on lesion probability maps of WMLs to observed performance in elderly individuals. (A) RVR-MMSE; (B) RVR-ANIMALS; (C) RVR-VEG; (D) RVR-LOGIMEM; (E) RVR-WAIS; (F) RVR-TRAILB; (G) RVR-TRAIL B-A; (H) RVR-MEMUNITS. Scores of participants with cognitive impairment: participants with mild cognitive impairment (MCI) are colored orange, those clinically diagnosed with Alzheimer’s dementia (AD) are colored yellow. Cognitively healthy participants with WMLs are colored blue.