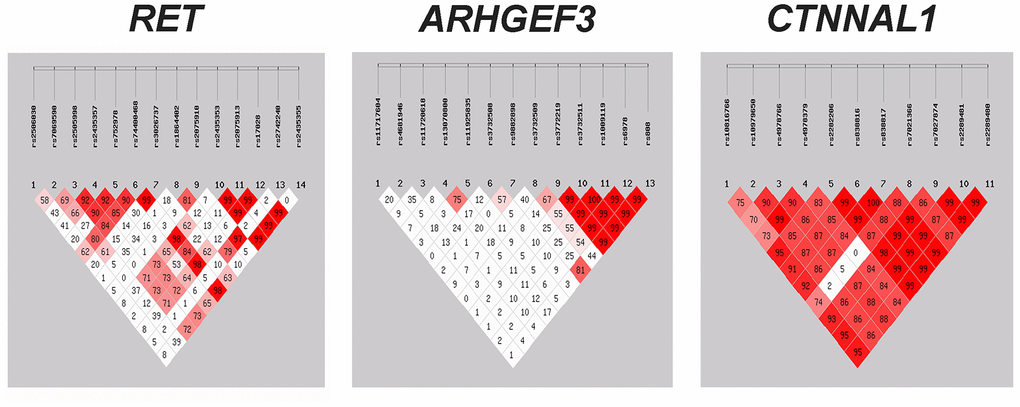
Figure 1.Assessment of linkage disequilibrium (LD) between the genetic variants within RET, ARHGEF3 and CTNNAL1. The matrices represent the D' value between the SNP pairs. Red matrices denote D' > 70%. SNP = single nucleotide polymorphism.
Figure 1 — Genetic variants in RET, ARHGEF3 and CTNNAL1, and relevant interaction networks, contribute to the risk of Hirschsprung disease | Aging