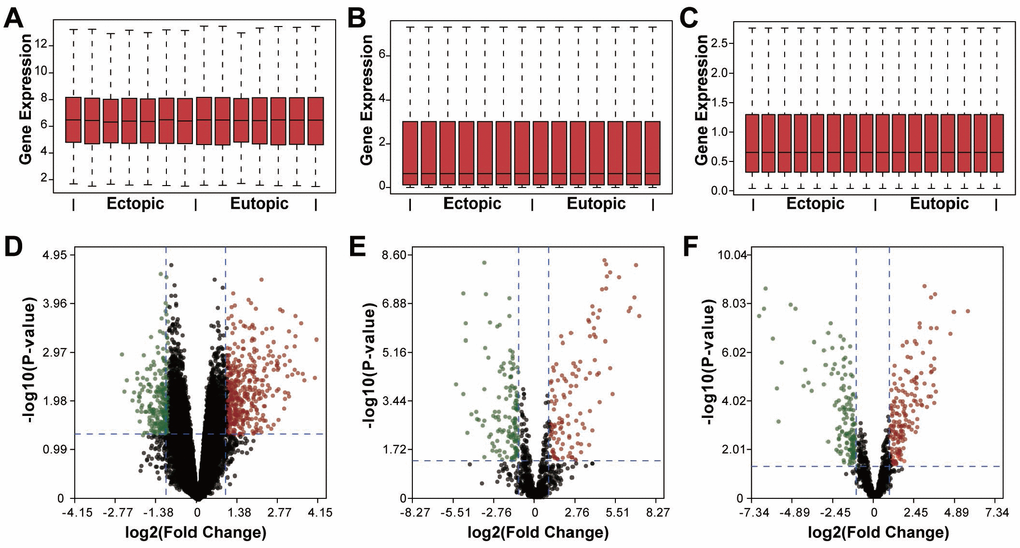
Figure 1.Identification of differentially expressed RNAs in endometriosis. (A–C) Box plots showing the expression of mRNAs, miRNAs, and lncRNAs. (D–F) Volcano plots of differentially expressed mRNAs, miRNAs, and lncRNAs. Red dots, upregulation, green dots, downregulation, black dots, rational expression.