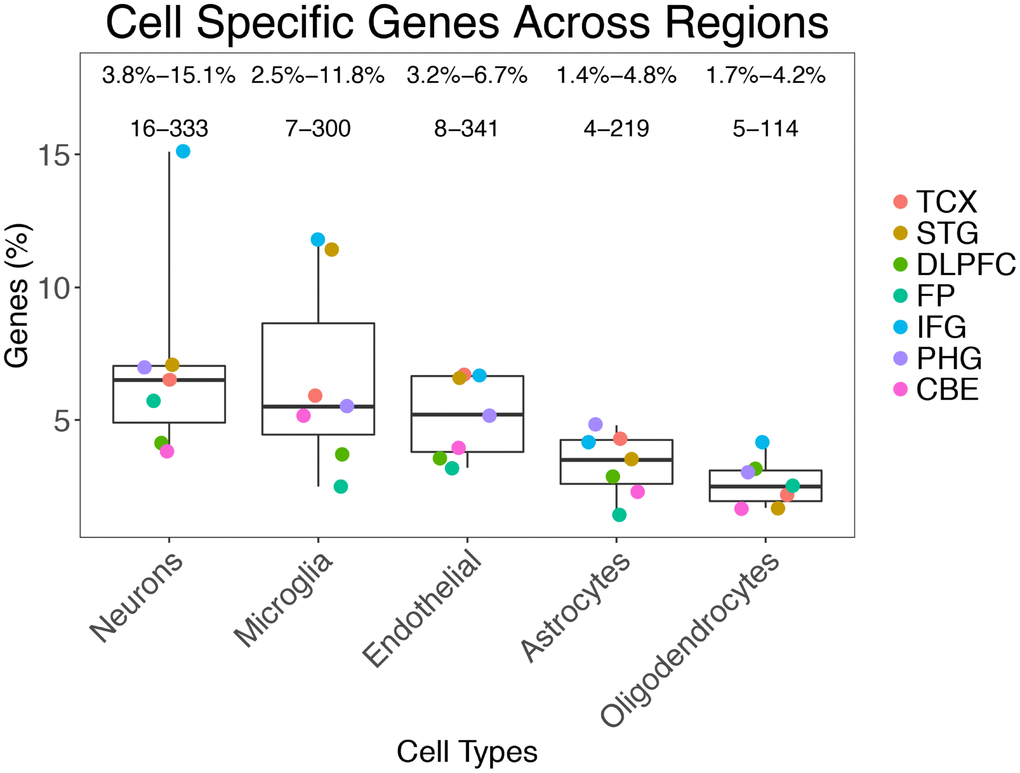
Figure 1.Prevalence of gene classes expressed in different cells across the brain regions analyzed.
Figure 1 — ESHRD: deconvolution of brain homogenate RNA expression data to identify cell-type-specific alterations in Alzheimer’s disease | Aging