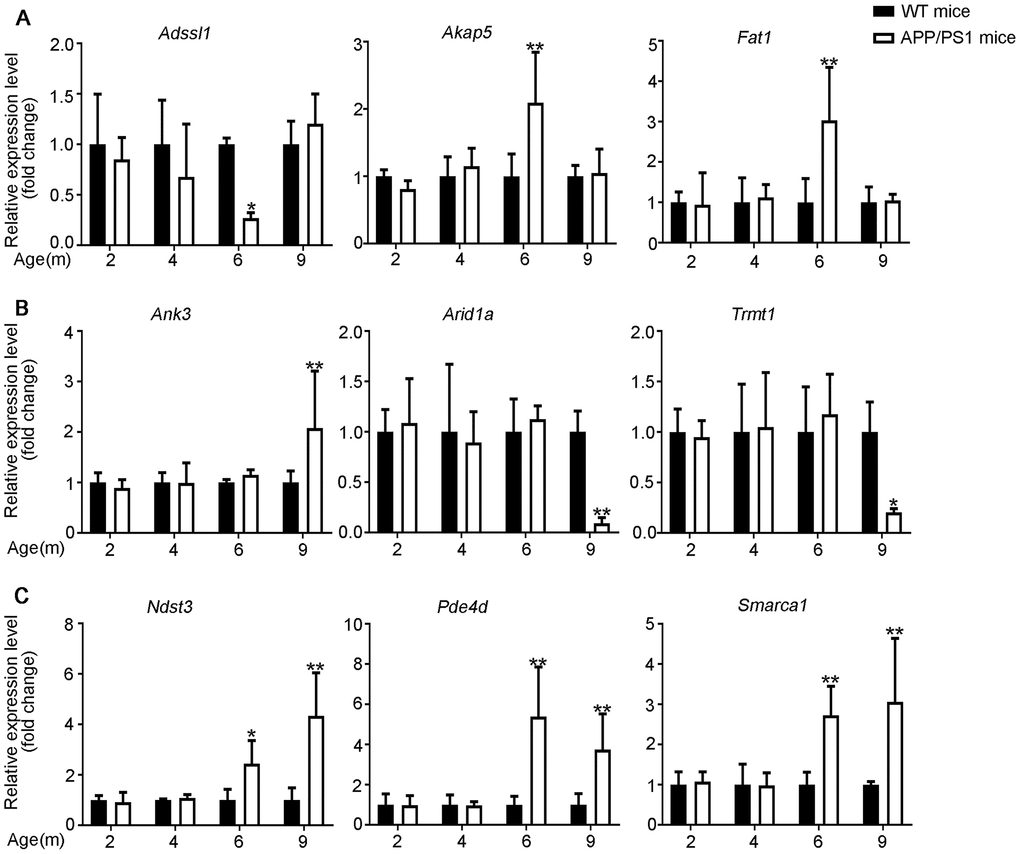
Figure 5.Validation of mRNA expression by using qPCR. (A) 6yes9no group, (B) 6no9yes group, and (C) 6yes9yes group. The mRNA expression was quantified relative to Gapdh expression level by using the comparative cycle threshold (ΔCT) method. Data are presented as means ± SD (n = 3, *p < 0.05, **p < 0.01).