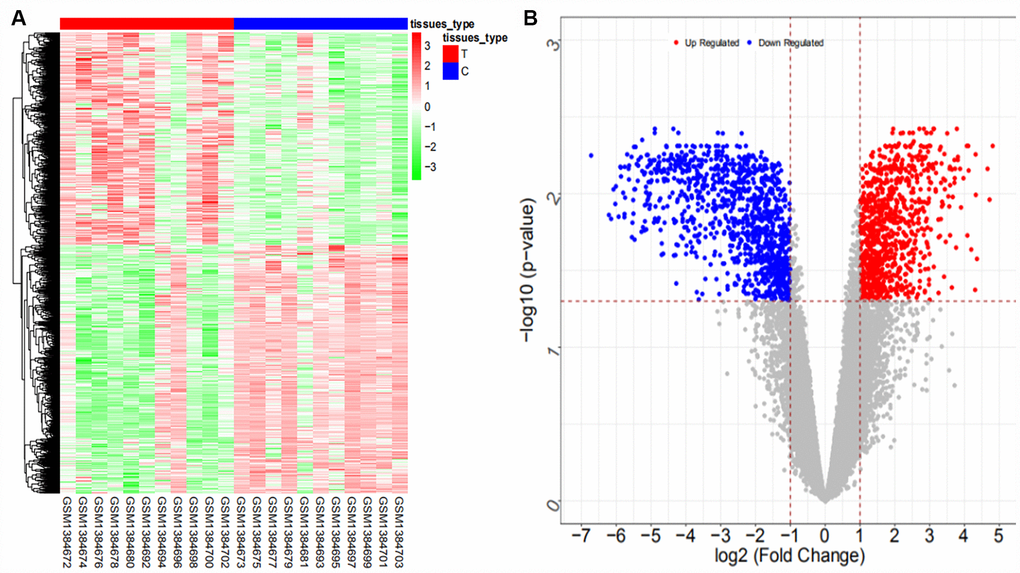
Figure 5.Heat map (A) and volcano map (B) of differentially expressed mRNAs in the GSE57555 dataset.
Figure 5 — CeRNA regulatory network-based analysis to study the roles of noncoding RNAs in the pathogenesis of intrahepatic cholangiocellular carcinoma | Aging