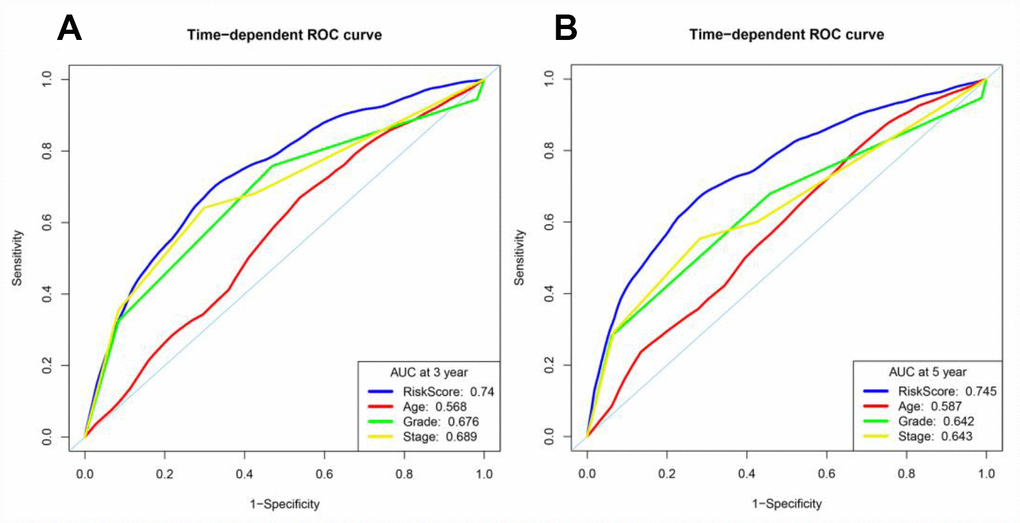
Figure 9.Time-dependent ROC curve analyses of different variables in the entire TCGA cohort at three and five years. (A) AUC at three years. (B) AUC at five years.
Figure 9 — Prognostic value of immune-related genes in clear cell renal cell carcinoma | Aging